10 of the Best Office Markets for the 2026 Recovery
The national office market is improving, but the recovery is not reaching every city, submarket, or building at the same time, in part due to AI.
Four-quarter net absorption reached 14.3 million square feet in the second quarter of 2026, its strongest reading since 2020. National vacancy also declined year over year, and more than half of the markets tracked by Cushman & Wakefield recorded improving vacancy. At the same time, outdated buildings continue to lose tenants while well-located Class A properties capture a growing share of leasing activity.
That split matters when you compare the best office markets for investors. A metro can report improving demand while still carrying millions of square feet of functionally obsolete space. Another market may have a low vacancy rate but too little transaction activity to provide dependable pricing or liquidity.
To identify the strongest markets, we reviewed property fundamentals, construction, employment, demographic demand, investment conditions, and risks. The result is not a prediction that every office property in these cities will perform well. It is a list of markets where the current balance of demand, supply, and investment opportunity deserves closer attention.
Build a Stronger Rental Property Business
Subscribe to our 2X weekly newsletter to learn more about managing tenants, protecting cash flow, improving rental operations, and making better real estate investment decisions.
Office Demand Is Returning to a Smaller Market
The office sector is no longer moving in one direction.
According to the Cushman & Wakefield Q2 2026 U.S. Office MarketBeat, national vacancy ended the quarter at 20.1%. Quarterly absorption was slightly negative, but the four-quarter total reached a six-year high. Vacancy declined both quarterly and annually in more than half of the 92 markets included in the report.
The supply side is also helping. Only 19.7 million square feet of office space was under construction nationally at the end of the second quarter. That was less than 30% of the long-term average. Deliveries over the preceding four quarters fell to a 14-year low, while conversions, demolitions, and repositioning removed approximately 33 million square feet from the national inventory over five quarters.
Demand remains heavily concentrated in better buildings. Class A properties generated 24.5 million square feet of positive absorption over the preceding four quarters, and Class A vacancy declined in two-thirds of the markets tracked by Cushman & Wakefield.
CBRE’s figures reinforce that divide. Its Q1 2026 U.S. Office Market Report placed overall vacancy at 18.6% but prime-building vacancy at 12.7%. Average asking rents increased 2.2% year over year, while the rents tenants actually agreed to pay rose 2.7%. CBRE also forecast a 20% increase in office investment volume for 2026 and reported that permanent-loan leverage had begun to improve.
The national vacancy figures from CBRE and Cushman & Wakefield are different because the firms do not use identical inventories, market boundaries, or property classifications. That difference is one reason you should focus on direction, building quality, and local definitions rather than comparing isolated numbers from unrelated reports.
The opportunity in 2026 is therefore not a broad bet that all offices are coming back. It is a more selective investment case built around strong locations, competitive buildings, limited new supply, and acquisition prices that reflect the remaining risks.
How the Markets Were Evaluated
This ranking was built from published market data rather than general impressions about which cities appear to be growing.
The principal comparative source was the Q2 2026 U.S. Office MarketBeat from Cushman & Wakefield. The report provides a consistent set of vacancy, absorption, leasing, asking-rent, inventory, delivery, and construction figures for 92 U.S. office markets. Using one main dataset for comparable metrics reduces the risk of ranking one market with a broad metropolitan inventory and another with a smaller central-business-district inventory.
Cushman & Wakefield defines overall vacancy as unoccupied direct and sublease space that is immediately available or expected to become available by the end of the quarter. Its inventory generally excludes owner-occupied and federally owned buildings that do not compete for tenants. The company also notes that individual market inventories can differ according to local building-size thresholds and competitive-property definitions.
We compared those figures with the CBRE U.S. office report and JLL’s U.S. Office Market Dynamics research. Those sources provided additional evidence on prime-building vacancy, leasing, effective pricing, transaction volume, financing, and loan distress. JLL reported that leasing activity increased 7.6% year over year in the first quarter and single-asset office sales reached their highest first-quarter total since 2020, although office-loan delinquency continued to rise.
Economic conditions were reviewed using Bureau of Labor Statistics metropolitan employment data. Population and migration trends were checked against the Census Bureau’s Vintage 2025 metropolitan estimates. These sources help distinguish office demand supported by employment and population growth from temporary absorption caused by one large lease or an inventory adjustment.
We also considered investor and development sentiment from Emerging Trends in Real Estate 2026, produced by PwC and the Urban Land Institute. That report is based on industry surveys and interviews, so it was treated as a sentiment indicator rather than a substitute for property-market data.
The markets were evaluated across five broad categories:
- Property fundamentals — 35%. Overall and Class A vacancy, vacancy direction, net absorption, leasing activity, rent movement, and sublease availability.
- Supply conditions — 20%. Space under construction, recent deliveries, planned projects, conversions, demolitions, and inventory removals.
- Economic and demographic demand — 20%. Employment, office-using industries, population growth, migration, and the depth of the tenant base.
- Investment conditions — 15%. Transaction liquidity, investor interest, pricing, financing access, and the potential to acquire buildings at a reset cost basis.
- Market risks — 10%. Excess vacancy, obsolete inventory, tenant concentration, taxes, insurance, regulatory costs, and dependence on a narrow group of industries.
No market qualified based on one statistic. Low vacancy helped, but it did not overcome weak leasing, poor liquidity, or a large construction pipeline. Rapid absorption also did not automatically produce a high ranking when a market retained enough vacant space to suppress rents for years.
Local brokerage reports were used to verify the national figures and examine submarkets, property classes, and major leases. Where firms reported materially different vacancy or absorption figures, the article identifies the difference rather than presenting the numbers as interchangeable.
The Best Office Markets for Investors in 2026
| Rank | Market | Overall vacancy | 12-month absorption | Main strength | Main risk |
|---|---|---|---|---|---|
| 1 | Manhattan | 17.7%–22.3% by district | Approximately 10.0 million sq. ft. | Recovery at scale and extremely tight prime space | Expensive improvements and weak older buildings |
| 2 | Orange County | 14.4% | Approximately 3.0 million sq. ft. | Sharp vacancy decline with little construction | Recent gains include several large occupancies |
| 3 | Salt Lake City | 12.2% | Approximately 790,000 sq. ft. | Strong absorption and almost no new supply | Smaller and less liquid than gateway markets |
| 4 | Miami | 14.6% | Approximately 378,000 sq. ft. | Rent strength and continued tenant demand | High acquisition and ownership costs |
| 5 | Dallas-Fort Worth | 24.9% in Dallas | Approximately 3.0 million sq. ft. in Dallas | Deep tenant base and strong Class A absorption | Large amount of existing vacant space |
| 6 | San Francisco | 30.1% | Approximately 3.2 million sq. ft. | Fastest major-market turnaround | Vacancy remains exceptionally high |
| 7 | Charlotte | 23.9% | Approximately 1.0 million sq. ft. | New financial-services demand | Older buildings continue to struggle |
| 8 | Phoenix | 25.4% | Approximately 1.3 million sq. ft. | Six-year-high absorption with little construction | Market-wide vacancy remains elevated |
| 9 | Nashville | 16.3% | Approximately 161,000 sq. ft. | Class A absorption and limited supply | Recent construction still affects some submarkets |
| 10 | Richmond | 11.1% | Approximately 541,000 sq. ft. | Low vacancy and steady Class A demand | Smaller transaction market |
1 Manhattan
Overall vacancy 17.7%–22.3% by district
12-month absorption Approximately 10.0 million sq. ft.
Main strength Recovery at scale and extremely tight prime space
Main risk Expensive improvements and weak older buildings
2 Orange County
Overall vacancy 14.4%
12-month absorption Approximately 3.0 million sq. ft.
Main strength Sharp vacancy decline with little construction
Main risk Recent gains include several large occupancies
3 Salt Lake City
Overall vacancy 12.2%
12-month absorption Approximately 790,000 sq. ft.
Main strength Strong absorption and almost no new supply
Main risk Smaller and less liquid than gateway markets
4 Miami
Overall vacancy 14.6%
12-month absorption Approximately 378,000 sq. ft.
Main strength Rent strength and continued tenant demand
Main risk High acquisition and ownership costs
5 Dallas-Fort Worth
Overall vacancy 24.9% in Dallas
12-month absorption Approximately 3.0 million sq. ft. in Dallas
Main strength Deep tenant base and strong Class A absorption
Main risk Large amount of existing vacant space
6 San Francisco
Overall vacancy 30.1%
12-month absorption Approximately 3.2 million sq. ft.
Main strength Fastest major-market turnaround
Main risk Vacancy remains exceptionally high
7 Charlotte
Overall vacancy 23.9%
12-month absorption Approximately 1.0 million sq. ft.
Main strength New financial-services demand
Main risk Older buildings continue to struggle
8 Phoenix
Overall vacancy 25.4%
12-month absorption Approximately 1.3 million sq. ft.
Main strength Six-year-high absorption with little construction
Main risk Market-wide vacancy remains elevated
9 Nashville
Overall vacancy 16.3%
12-month absorption Approximately 161,000 sq. ft.
Main strength Class A absorption and limited supply
Main risk Recent construction still affects some submarkets
10 Richmond
Overall vacancy 11.1%
12-month absorption Approximately 541,000 sq. ft.
Main strength Low vacancy and steady Class A demand
Main risk Smaller transaction market
Vacancy, absorption, construction, inventory, and rent figures in the table are principally based on Cushman & Wakefield’s Q2 2026 national dataset. Manhattan includes Midtown, Midtown South, and Downtown. Cushman & Wakefield reports Dallas and Fort Worth separately, so the comparable figures shown for Dallas-Fort Worth primarily reflect the larger Dallas inventory.
1. Manhattan

Manhattan ranks first because no other U.S. office market is producing the same combination of large-scale absorption, prime-space scarcity, leasing depth, and investment liquidity.
Across Midtown, Midtown South, and Downtown, trailing four-quarter net absorption approached 10 million square feet. Midtown accounted for approximately 8.6 million square feet of that total. Cushman & Wakefield measured second-quarter vacancy at 17.7% in Midtown, 17.8% in Midtown South, and 22.3% Downtown. Midtown and Midtown South vacancy fell by 265 and 230 basis points, respectively, from a year earlier.
The Q2 2026 Manhattan Office MarketBeat described Midtown’s vacancy rate as a 21-quarter low and reported positive year-to-date absorption for a fourth consecutive quarter. Some of that improvement came from office buildings being removed for residential conversion, but leasing also strengthened across the market.
The strongest case for Manhattan is the scarcity of prime space. CBRE placed Midtown Manhattan’s prime vacancy rate at only 2.9% in the first quarter. That is a different market from older towers with inefficient floor plates, dated mechanical systems, or expensive capital needs.
New construction is not completely absent. More than 4.4 million square feet was under construction in Midtown at the end of the second quarter. However, new trophy buildings are entering a market where the best existing properties already have limited availability.
Best fit: Prime and near-prime buildings with durable tenant rosters, recently recapitalized Class A properties, and older assets that can support a realistic renovation or conversion plan.
Main risk: Manhattan’s recovery does not extend evenly across its inventory. An apparently inexpensive older building can require major spending on elevators, mechanical systems, amenities, energy compliance, and tenant improvements before it can compete.
2. Orange County
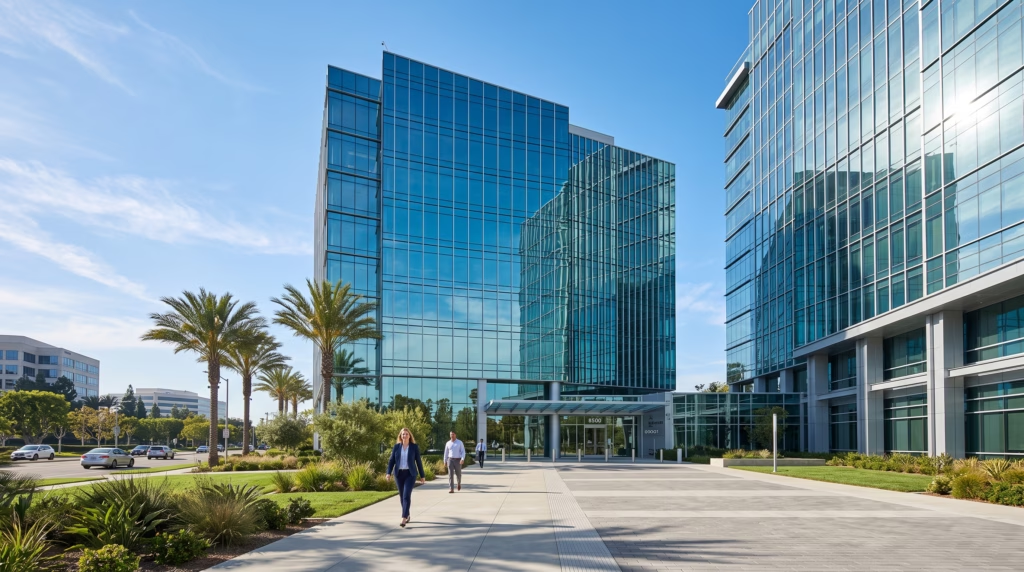
Orange County combines one of the country’s strongest vacancy improvements with a relatively low construction pipeline.
Overall vacancy fell from 17.8% in the second quarter of 2025 to 14.4% one year later. Trailing four-quarter absorption reached approximately 3.0 million square feet, equal to more than 3% of the market’s inventory. Cushman & Wakefield also identified Orange County as one of the nation’s leading markets for Class A demand, with approximately 2.1 million square feet of Class A absorption over the preceding year.
Only about 277,000 square feet was under construction at midyear, compared with an inventory of nearly 89 million square feet. That limited pipeline gives the market time to absorb existing availability without competing against a large wave of new deliveries.
The quarterly pattern was not perfectly smooth. Orange County recorded slightly negative absorption in the second quarter after exceptionally large gains in late 2025 and early 2026. The longer trend remains positive, but the timing of several large occupancies inflated individual quarters.
The market also benefits from a diversified tenant base that includes financial services, technology, health care, professional services, and businesses tied to the broader Southern California economy. Its asking rents remain well below San Francisco and Manhattan, even though high-quality buildings can command a premium within their individual submarkets.
Best fit: Modern Class A properties with good access, efficient floor plates, and amenities that can attract tenants moving out of older buildings.
Main risk: Investors should determine how much recent absorption resulted from repeatable leasing demand and how much came from a small number of large move-ins. California ownership costs and regulatory requirements also need to be reflected in the acquisition price.
3. Salt Lake City
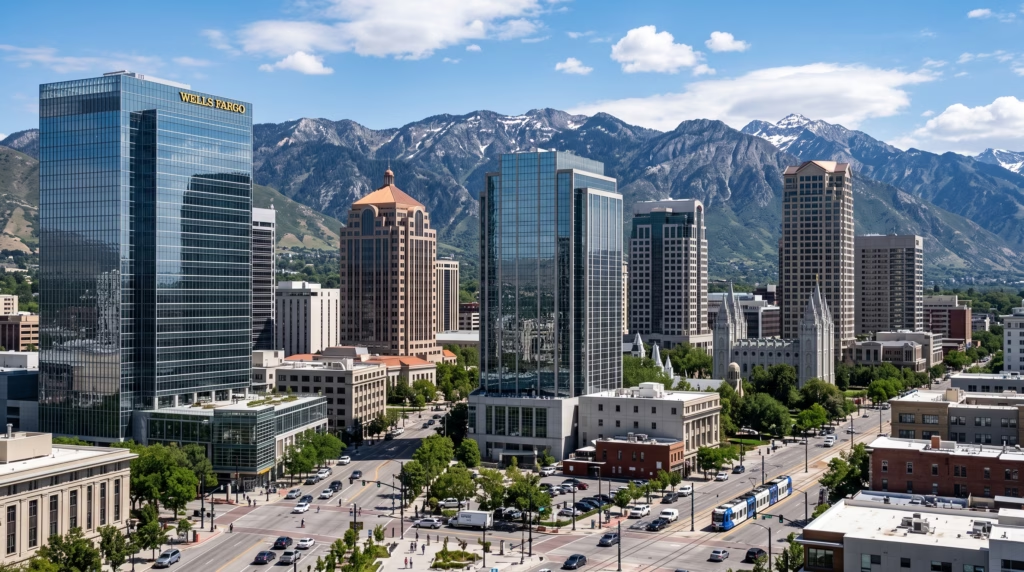
Salt Lake City offers one of the strongest demand-and-supply combinations in the ranking.
Cushman & Wakefield reported 12.2% overall vacancy, approximately 790,000 square feet of trailing four-quarter absorption, and no office construction at the end of the second quarter. Its measured inventory totaled approximately 51.7 million square feet.
A separate Salt Lake County report from Colliers found more than 710,000 square feet of positive absorption during the first half of 2026. It also reported seven consecutive quarters of occupancy gains and overall vacancy below 20% for the first time in more than two years.
CBRE uses a wider Salt Lake City–Provo market and reported a higher 22.6% vacancy rate. Despite the difference in boundaries and inventory, CBRE also found positive absorption, seven consecutive quarters of occupancy growth, no office projects under construction, and substantial reductions in sublease space. The direction is therefore consistent even though the headline vacancy rates are not.
The economic side also supports the ranking. Salt Lake City was among the large metropolitan areas with the fastest year-over-year employment growth in May 2026, according to the Bureau of Labor Statistics.
Best fit: Well-maintained Class A and upper-Class B properties in established business districts, particularly buildings that can compete on access, parking, floor-plate efficiency, and operating cost.
Main risk: Salt Lake City has less transaction depth than Manhattan, Dallas, or San Francisco. A smaller buyer pool can make pricing less transparent and reduce exit liquidity, particularly for large buildings or properties outside the strongest submarkets.
4. Miami
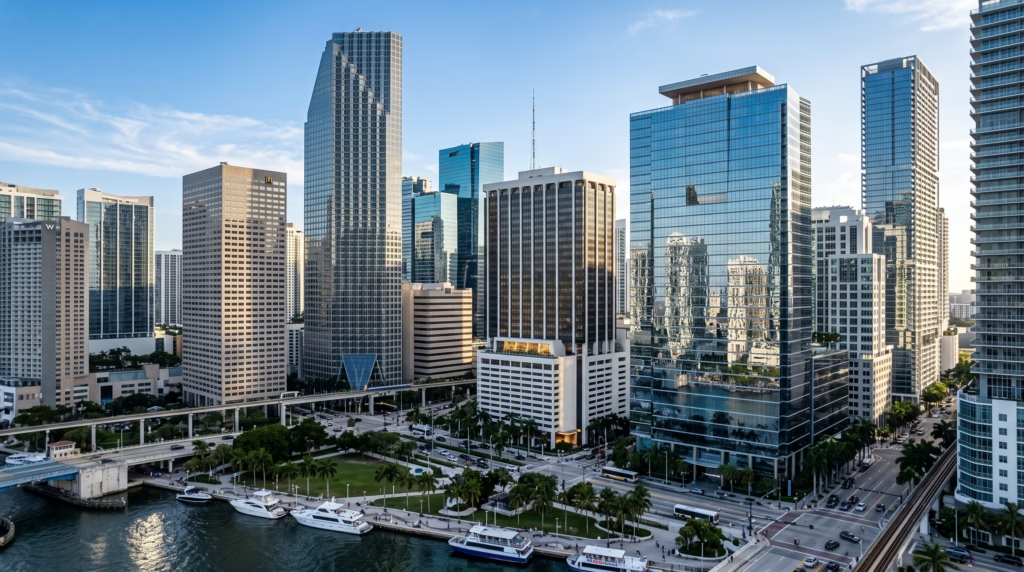
Miami remains one of the few major office markets where tenant demand, rents, and investor interest are all supporting the same investment case.
Cushman & Wakefield reported a 14.6% vacancy rate, approximately 378,000 square feet of trailing four-quarter absorption, and an average asking rent of $66.40 per square foot. Only about 395,000 square feet was under construction within its measured Miami inventory.
CBRE’s Q2 2026 Miami Office Figures reached a similar conclusion. CBRE measured vacancy at 14.9%, quarterly net absorption at 344,000 square feet, and average asking rents at $68.60.
Leasing has moderated from some of the unusually strong periods that followed the pandemic-era migration of firms and executives to South Florida. Cushman & Wakefield reported that year-to-date leasing was lower than in 2025, although second-quarter transaction volume increased substantially from the first quarter.
Miami ranked third in PwC and ULI’s overall list of real estate markets to watch for 2026. That survey is not office-specific, but it confirms that institutional investors continue to view the broader market favorably.
Best fit: High-quality properties in established business districts, buildings that appeal to financial and professional-services tenants, and well-leased assets where the purchase price does not assume uninterrupted rent growth.
Main risk: Strong demand is already reflected in rents and acquisition expectations. Investors also need to account for insurance, property taxes, wind exposure, flood risk, and the cost of maintaining a competitive building in a humid coastal environment.
5. Dallas-Fort Worth

Dallas-Fort Worth has more vacant office space than the four markets ranked above it, but few U.S. metros can match its combination of scale, tenant depth, leasing volume, and economic reach.
Cushman & Wakefield tracks Dallas and Fort Worth separately. Dallas, the larger office market, recorded a 24.9% vacancy rate and approximately 3.0 million square feet of trailing four-quarter absorption. Class A absorption reached roughly 3.1 million square feet over the same period, placing Dallas among the strongest Class A markets in the country.
Dallas also generated approximately 7.4 million square feet of leasing activity in the first half of 2026. About 1.8 million square feet remained under construction, which is material but modest relative to a Dallas inventory exceeding 213 million square feet.
The Dallas Q2 2026 Office MarketBeat projected that overall vacancy could fall to 23.3% or less by year-end as known occupancies outpace scheduled move-outs and deliveries.
Dallas-Fort Worth also ranked first in PwC and ULI’s overall Markets to Watch list for the second consecutive year. The region’s large and diverse economy gives owners access to corporate headquarters, financial services, technology, professional services, health care, and other office users.
Best fit: Competitive Class A buildings in established growth submarkets, newer suburban offices with strong access and parking, and recapitalized properties purchased below replacement cost.
Main risk: A 24.9% vacancy rate still represents a substantial amount of available space. Market-wide averages also conceal large differences among Dallas, Fort Worth, and individual suburban business districts. Buying in the metro is not enough; the building must compete within its immediate leasing area.
Build a Stronger Rental Property Business
Subscribe to our 2X weekly newsletter to learn more about managing tenants, protecting cash flow, improving rental operations, and making better real estate investment decisions.
6. San Francisco

San Francisco is the highest-risk market in the top 10, but it also has one of the clearest recovery stories.
Overall vacancy ended the second quarter at 30.1%. That remains exceptionally high, but it was 360 basis points below the rate recorded a year earlier. San Francisco generated just over 1 million square feet of positive absorption during the quarter, nearly 2.2 million square feet during the first half, and approximately 3.2 million square feet over the preceding four quarters.
Sublease vacancy fell to its lowest level since early 2020. Cushman & Wakefield also reported that 13.7% of the market’s vacant space had already been leased and was awaiting tenant occupancy, suggesting that reported vacancy should decline as those leases commence.
The flight to quality is especially pronounced. Tier 1 Class A buildings had an 8.2% direct vacancy rate and direct asking rents approaching $107 per square foot. The citywide average tells you very little about the difference between these buildings and older commodity offices.
San Francisco also had no office space under construction in Cushman & Wakefield’s Q2 national inventory. That gives the existing market an opportunity to absorb available space without competing with a new development cycle.
Best fit: Top-tier Class A properties, buildings near growing technology and artificial-intelligence tenants, and recapitalized assets acquired at a basis that leaves room for major tenant improvements and leasing costs.
Main risk: Thirty percent vacancy cannot be dismissed as a temporary statistical problem. Many older buildings remain poorly positioned, and owners may face long lease-up periods, expensive improvements, high taxes, regulatory costs, and uncertain exit values.
7. Charlotte
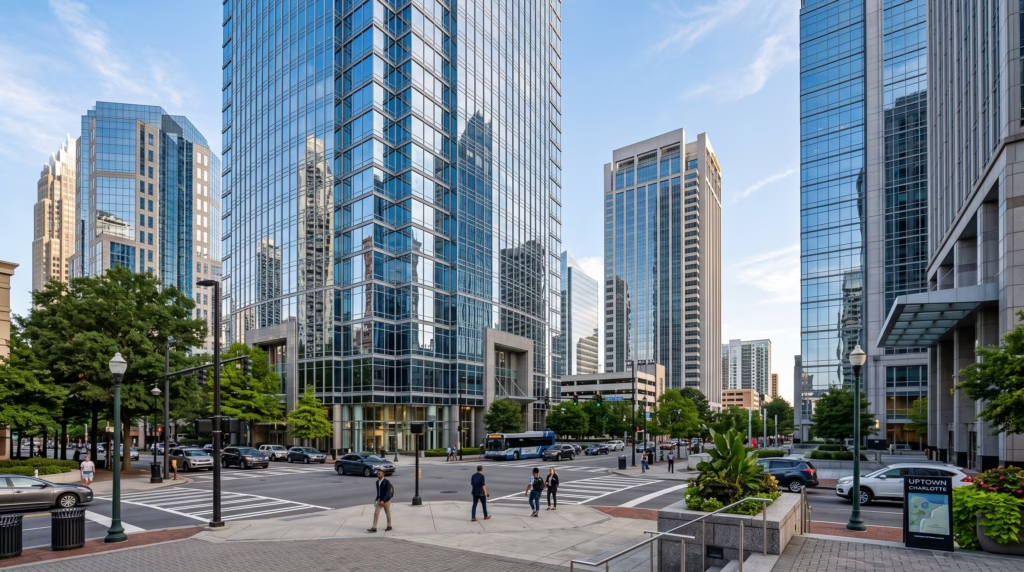
Charlotte’s office recovery is being supported by a tenant base that includes banking, investment management, insurance, professional services, energy, and health care.
The national Cushman & Wakefield dataset placed overall vacancy at 23.9%, down from 25.9% a year earlier. Trailing four-quarter absorption reached approximately 1.0 million square feet, and only about 400,000 square feet remained under construction.
Other reports use narrower inventories and show lower vacancy. Colliers’ Q2 Charlotte report measured vacancy at 16.0% after 660,589 square feet of positive absorption during the quarter.
The size of that difference demonstrates why property definitions matter. It does not invalidate either report. One dataset may exclude smaller, older, or noncompetitive buildings that remain in another firm’s inventory.
Leasing evidence supports the broader recovery. Savills reported that quarterly activity exceeded 1.2 million square feet for a fourth consecutive quarter, helped by two financial-services firms establishing new operations in the central business district.
Best fit: Newer and renovated Class A buildings that can attract financial and professional-services users, particularly assets with modern amenities, good access, and enough nearby housing and services to support employee recruitment.
Main risk: Older properties account for much of the market’s weakness. Investors should not apply leasing results from newer buildings to offices with dated systems, inefficient layouts, limited amenities, or poor connections to Charlotte’s strongest employment districts.
8. Phoenix
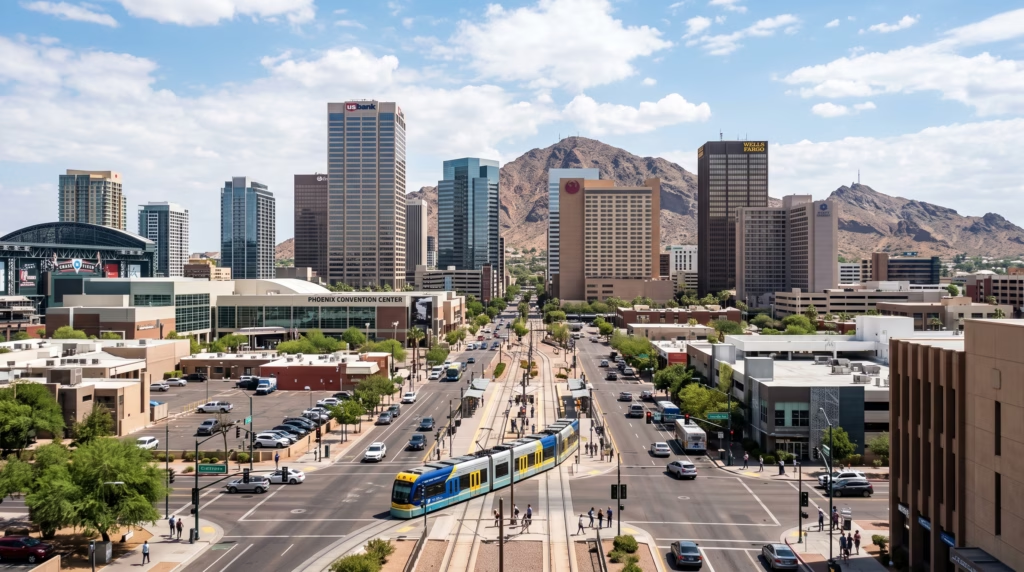
Phoenix has moved from a market with persistent occupancy losses to one of the stronger large-market recoveries in the West.
Office vacancy fell to 25.4% in the second quarter, its fastest quarterly decline in more than a decade. Net absorption reached approximately 450,000 square feet for the quarter and 1.3 million square feet over the preceding year, the market’s strongest trailing annual total in six years.
Leasing totaled approximately 1.5 million square feet in the second quarter, an increase of nearly 13% from the first quarter. Demand was positive during six of the preceding seven quarters, helping reduce vacancy by 250 basis points from its recent peak.
The supply outlook strengthens the case. Cushman & Wakefield reported only about 145,000 square feet under construction against an inventory of more than 86 million square feet.
Phoenix also continued to add jobs. Cushman & Wakefield’s local report recorded a metro employment increase of approximately 20,500 positions over the year. The region’s population base, business expansion, and relative cost advantage should continue to create office demand, although office growth will not necessarily match the pace of residential and industrial development.
Best fit: Well-located Class A and upper-Class B properties with competitive parking, efficient cooling systems, and access to large employment and residential areas.
Main risk: Vacancy above 25% gives tenants substantial choice. Owners must budget for concessions and improvements, and older buildings may struggle even as the overall market reports positive absorption.
9. Nashville
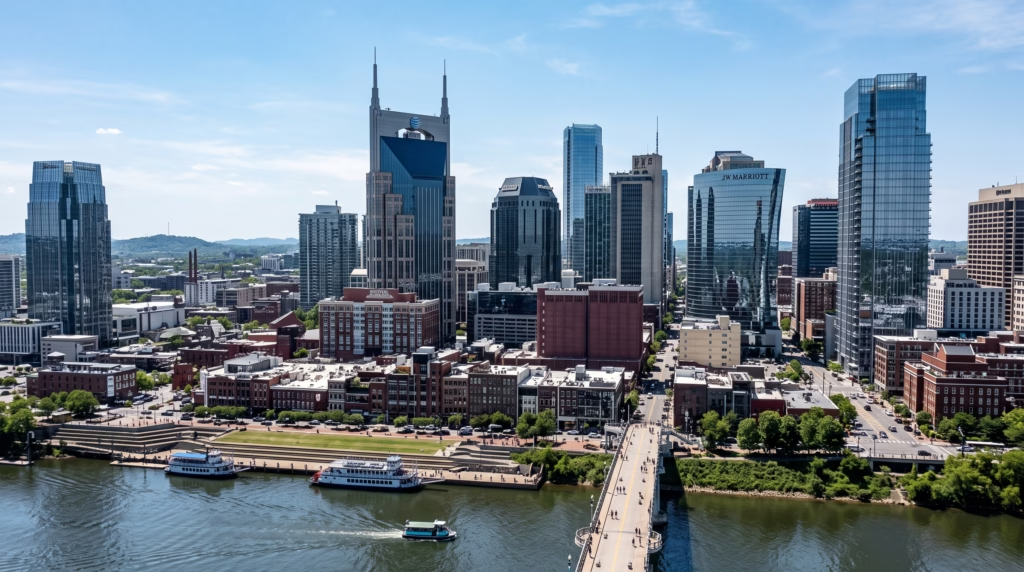
Nashville’s office market has moved into a gradual absorption period after several years of construction and corporate expansion.
Cushman & Wakefield reported overall vacancy of 16.3%, approximately 161,000 square feet of trailing four-quarter absorption, and about 291,000 square feet under construction.
Other firms reported stronger second-quarter absorption. CBRE measured 351,000 square feet of quarterly net absorption, 17.5% vacancy, no new deliveries, and approximately 295,000 square feet under construction.
Colliers reported more than 526,000 square feet of second-quarter absorption and found that nearly all the gains occurred in Class A properties. Its measured vacancy fell for a fourth consecutive quarter to 18.2%, while Class A asking rents remained above the market average.
The exact figures vary because the inventories differ, but the reports point in the same direction: vacancy is declining, construction has slowed, and newer Class A buildings are capturing most of the demand.
Nashville ranked sixth in PwC and ULI’s overall Markets to Watch list for 2026, reflecting continued investor confidence in the broader metro.
Best fit: Stabilized Class A offices, newer suburban properties with established tenant demand, and buildings acquired after enough repricing to cover lease-up and improvement costs.
Main risk: Some submarkets are still absorbing recently delivered space. Investors should examine concessions and effective rents rather than relying only on quoted asking rates.
10. Richmond
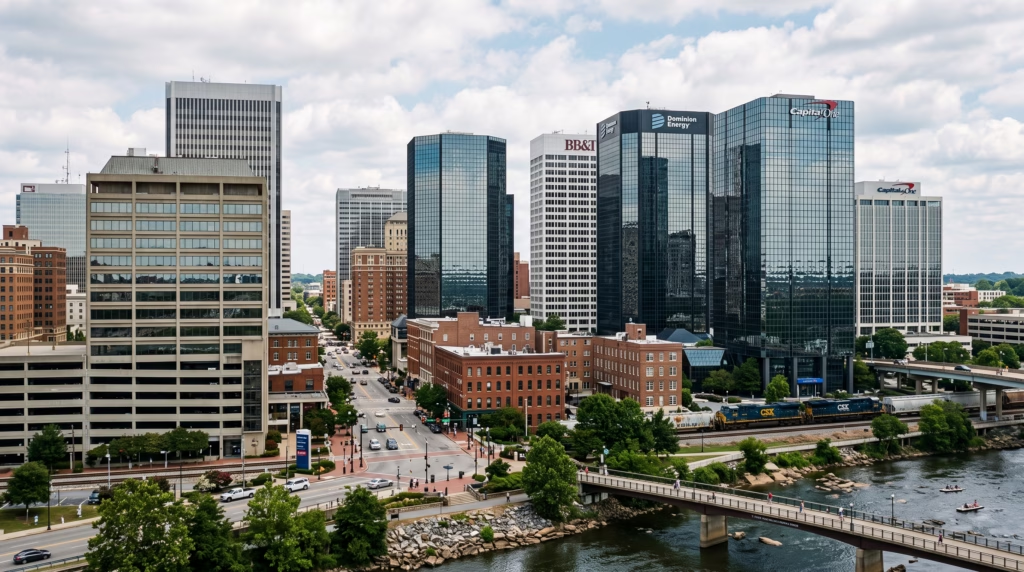
Richmond earns the final position because it combines low vacancy, positive absorption, limited construction, and a relatively stable tenant base.
Overall vacancy fell to 11.1% in the second quarter, down 140 basis points from a year earlier. Trailing four-quarter absorption reached approximately 541,000 square feet, while only about 108,000 square feet was under construction.
Richmond was also among the markets with the strongest year-over-year improvements in Class A vacancy. The local Q2 Richmond MarketBeat confirmed the 11.1% overall vacancy rate and its continued decline.
The market benefits from a mix of state government, finance, insurance, health care, legal, professional-services, and corporate tenants. That mix does not produce the rapid leasing surges seen in Manhattan or San Francisco, but it can support more consistent occupancy.
Richmond’s lower asking rents can also make the market attractive to tenants and buyers that cannot justify gateway-market costs. However, lower rents limit the amount an owner can spend on improvements before the investment becomes difficult to support.
Best fit: Stabilized Class A and upper-Class B buildings with manageable lease rollover, established local tenants, and limited near-term capital requirements.
Main risk: Richmond is a smaller investment market. Large properties may take longer to sell, fewer transactions are available for pricing comparisons, and rent growth may not compensate for an overly aggressive acquisition price.
Three Office Markets Worth Watching
Las Vegas
Las Vegas reported a 12.3% vacancy rate, approximately 398,000 square feet of trailing four-quarter absorption, and less than 20,000 square feet under construction. The metro was also among the large markets with the strongest year-over-year employment growth in May 2026.
It missed the top 10 because its office market is smaller and its economy remains more exposed to tourism and consumer spending than the markets above it. Continued tenant diversification could move Las Vegas into a future ranking.
Kansas City
Kansas City generated approximately 886,000 square feet of trailing four-quarter absorption and was one of the leading markets for Class A vacancy improvement. Overall vacancy ended the second quarter at 18.4%.
Kansas City offers lower occupancy costs and limited speculative development, but transaction liquidity and long-term rent growth are less certain than in larger markets.
Austin
Austin’s overall vacancy rate declined to 26.9% from 28.5% a year earlier. The market also recorded approximately 533,000 square feet of trailing four-quarter absorption. Average asking rents were 3.3% higher year over year, and Class A rents remained above $54 per square foot.
Austin did not reach the top 10 because net absorption was negative during the first half of 2026 and approximately 703,000 square feet remained under construction. The long-term technology and population story remains attractive, but the market needs more time to absorb recently delivered and available space.
What Could Change the Rankings
These rankings reflect the most recent data available in July 2026. Several developments could change the order over the next 12 to 24 months.
Office-using employment could weaken or accelerate. Professional and business services employment resumed growth nationally during 2026, but metropolitan results remain uneven. A market cannot sustain office absorption indefinitely without expanding tenants or new companies entering the region.
Signed leases must become actual occupancies. Some recovery markets have substantial leased space awaiting tenant move-in. Vacancy should decline as those leases commence, but delays, cancellations, or further tenant consolidations could change the outcome.
Financing conditions could improve. CBRE reported increasing loan-to-value ratios and forecast higher office investment volume, indicating that lenders and buyers were becoming more comfortable with strong assets. Lower borrowing costs or wider lender participation would help transaction volume and pricing.
Loan distress could force more sales. JLL reported that office delinquency continued to increase during the first quarter of 2026. Forced sales can provide attractive acquisition bases, but they can also create lower comparable sales and place more buildings under aggressive new ownership.
Conversions and demolitions could tighten selected submarkets. The national office inventory has already declined as obsolete buildings leave the competitive set. Markets that can remove vacant properties efficiently may improve faster than cities where physical, financial, or zoning problems prevent conversions.
A new construction cycle could eventually return. Current office construction is near a historic low, but shortages of prime space may justify new projects in selected districts. Those projects will take years to complete and will usually require high rents, strong preleasing, and substantial equity.
How Investors Should Use This List
A market ranking should narrow your search, not replace underwriting.
Start by identifying the investment strategy you intend to pursue. A stabilized Class A acquisition in Miami is not directly comparable to a distressed renovation in San Francisco or a suburban office purchase in Richmond.
Next, move from the metro to the submarket. Review vacancy, absorption, leasing activity, planned construction, tenant movements, and recent sales within the property’s actual competitive area. A market with 15% vacancy can still contain a submarket with 30% vacancy.
Then evaluate the building’s competitive position. Consider its age, location, parking, floor plates, elevators, mechanical systems, energy performance, amenities, accessibility, and nearby services. Tenants increasingly use the office as a recruitment and collaboration tool. A property that does not help them achieve those goals may require substantial investment or lower rents.
Review every major lease. Pay particular attention to:
- Expiration dates
- Renewal options
- Tenant credit
- Contract rent compared with current market rent
- Improvement obligations
- Free-rent periods
- Expense reimbursements
- Contraction and termination rights
- Space that is leased but not occupied
Calculate the cost of competing for tenants. Asking rents do not show free rent, brokerage commissions, tenant-improvement allowances, building upgrades, or downtime between leases. Effective rent and capital requirements matter more than the advertised rate.
Finally, stress-test the investment. Model lower occupancy, slower leasing, higher improvement costs, delayed refinancing, and a higher exit cap rate. An office acquisition should still make sense when the recovery takes longer than expected.
Where Office Investors Can Find Stronger Openings
The office market has passed the point where every city can be described with the same recovery story.
Manhattan is tightening at the prime end while older buildings remain difficult. San Francisco is producing strong absorption but still carries extraordinary vacancy. Miami and Salt Lake City offer lower vacancy and limited supply, while Dallas, Charlotte, and Phoenix provide large tenant bases alongside substantial existing availability.
The common thread is not geography. It is the growing separation between buildings that tenants want and buildings they will accept only at a steep discount.
The best office markets for investors in 2026 are therefore the markets where demand is improving, new supply is controlled, and a property can be purchased at a price that leaves enough capital to keep it competitive. Even in the highest-ranked city, the building, leases, submarket, and acquisition basis will determine whether the investment succeeds.