Best Real Estate Markets for Population & Job Growth 2026
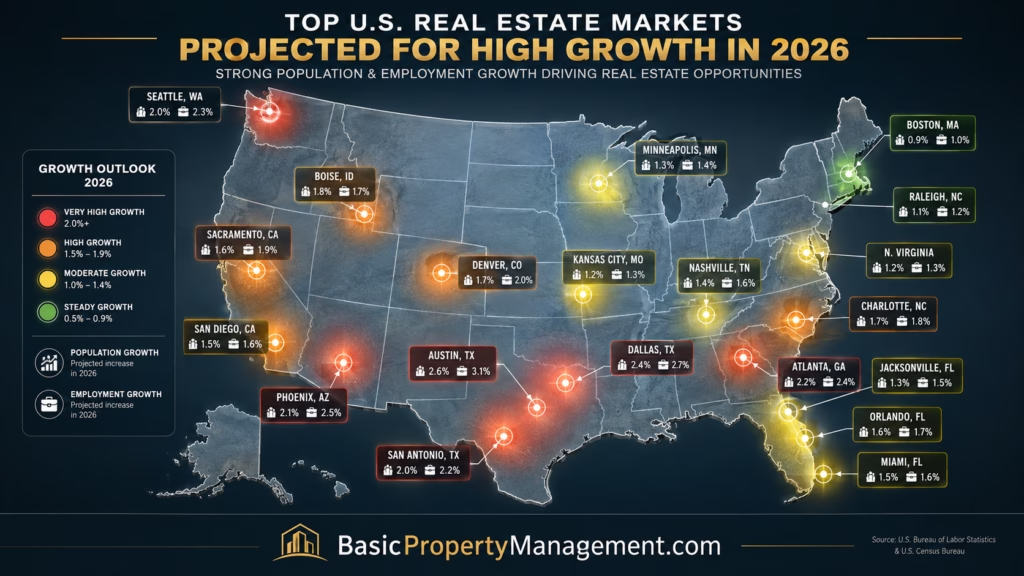
Population growth creates housing demand. Job growth gives people a reason—and the income—to remain in a market.
When the two occur together, residential real estate investors have a stronger demand signal than either measure provides on its own.
That does not mean every fast-growing metro is a good place to buy. New construction can keep pace with demand. Home prices may already reflect years of growth. Rents can stagnate even while population increases, and a rapidly expanding metro can contain neighborhoods with very different investment fundamentals.
Still, if you are looking for the best real estate markets based on underlying economic demand, population and employment provide a logical place to begin.
The latest government data reveal 15 metropolitan areas with populations of at least 500,000 that combine approximately 1% or greater recent population growth with at least 1% year-over-year payroll employment growth.
Some are familiar growth markets such as Austin, Charlotte and Dallas-Fort Worth. Others—including Northwest Arkansas, Huntsville, Greenville and Omaha—show why it is worth looking beyond the usual real estate investment lists.
Get Actionable Property Management Tips Twice a Week
Want smarter systems for managing rentals, screening tenants, handling maintenance, and improving property performance? Sign up for our 2X weekly newsletter and get practical property management and real estate investing insights delivered straight to your inbox.
How We Ranked the Best Real Estate Markets for Growth
This report relies primarily on two government datasets rather than forecasts or subjective market rankings.
The U.S. Census Bureau’s Vintage 2025 metropolitan population estimates provide population figures through July 1, 2025. Census identifies Vintage 2025 as its most recent completed and internally consistent set of metro population estimates.
Current employment growth comes from the Bureau of Labor Statistics Metropolitan Area Employment and Unemployment release, using nonfarm payroll employment from June 2025 through June 2026.
To qualify, a market needed:
- A 2025 metro population of at least 500,000
- Recent population growth that rounds to approximately 1.0% or more
- Year-over-year nonfarm employment growth of at least 1.0%
We then ranked the qualifying metros using:
- 40% recent population growth: 2024 to 2025
- 20% sustained population growth: 2020 to 2025
- 40% current employment growth: June 2025 to June 2026
Each factor is ranked on a percentile basis within the qualifying group before applying the weights. That avoids assuming, for example, that one percentage point of population growth has exactly the same economic meaning as one percentage point of job growth.
Omaha’s latest population increase is approximately 0.96% before rounding, so it appears as 1.0% in the comparison below.
Population and Job Growth at a Glance
| Rank | Metropolitan Area | 2024–25 Population Growth | 2020–25 Population Growth | Job Growth |
|---|---|---|---|---|
| 1 | Fayetteville–Springdale–Rogers, AR | 2.4% | 13.1% | 2.9% |
| 2 | Raleigh, NC | 2.4% | 12.6% | 2.6% |
| 3 | Provo–Orem–Lehi, UT | 1.9% | 14.5% | 2.0% |
| 4 | Lakeland–Winter Haven, FL | 2.7% | 19.8% | 1.4% |
| 5 | Austin, TX | 2.1% | 13.9% | 1.9% |
| 6 | Huntsville, AL | 2.6% | 12.5% | 1.3% |
| 7 | Charlotte, NC-SC | 1.9% | 10.1% | 1.6% |
| 8 | Greenville, SC | 1.4% | 9.0% | 2.0% |
| 9 | Boise, ID | 2.2% | 12.2% | 1.2% |
| 10 | Nashville, TN | 1.6% | 8.7% | 1.6% |
| 11 | Orlando, FL | 1.3% | 10.3% | 1.4% |
| 12 | Dallas–Fort Worth, TX | 1.5% | 10.6% | 1.3% |
| 13 | Houston, TX | 1.6% | 10.3% | 1.1% |
| 14 | Omaha, NE-IA | 1.0% | 4.2% | 1.6% |
| 15 | Phoenix, AZ | 1.1% | 7.3% | 1.4% |
Sources: U.S. Census Bureau Vintage 2025 Population Estimates; Bureau of Labor Statistics, June 2026 Metropolitan Area Employment.
15 Real Estate Markets Where People and Jobs Are Growing
1. Fayetteville–Springdale–Rogers, Arkansas
Northwest Arkansas earns the top position because both sides of the demand equation are moving quickly.
The Fayetteville–Springdale–Rogers metro grew approximately 2.4% between 2024 and 2025 and more than 13% from 2020 through 2025.
Employment is keeping pace. BLS reported 2.9% year-over-year payroll growth, one of the strongest rates among U.S. metropolitan areas in June.
That combination is more meaningful than population growth alone. New residents are entering a market where employers are also adding jobs.
The region’s economic base includes large employers and corporate activity tied to Walmart, Tyson Foods and J.B. Hunt, but investors still need to distinguish between the different communities across the metro.
Rapid growth can also attract substantial residential construction.
If you are evaluating Northwest Arkansas, compare household formation and new housing supply before assuming recent growth will automatically translate into stronger rents.
2. Raleigh, North Carolina
Raleigh provides one of the most balanced growth stories in the report.
Census estimates show metro population increasing 2.4% in the latest year and approximately 12.6% since 2020.
BLS reported 2.6% employment growth from June 2025 to June 2026. Among metropolitan areas with at least 1 million residents in the 2020 Census, Raleigh had one of the country’s strongest current employment-growth rates.
That is an important distinction.
A rapidly growing population without enough employment expansion can eventually weaken housing affordability and demand. Raleigh currently shows both.
Its technology, education, life-sciences and professional-services employment base also provides diversification beyond a single dominant industry.
For investors, the challenge may be acquisition pricing and local supply rather than finding evidence that the metro is expanding.
3. Provo–Orem–Lehi, Utah
Provo combines sustained demographic expansion with current job creation.
Its metro population grew approximately 1.9% over the latest year and 14.5% between 2020 and 2025, one of the strongest five-year increases among the qualifying markets.
Employment increased 2.0% year over year.
The Provo-Orem-Lehi corridor benefits from Utah’s broader technology and business-services economy, a comparatively young population and continued household formation.
Those characteristics can support long-term housing demand.
They can also create a pricing challenge.
Investors should compare current home values with achievable rent rather than treating strong demographic fundamentals as sufficient justification for a purchase. A growing tenant base is valuable only if the property’s income supports the acquisition cost.
4. Lakeland–Winter Haven, Florida
No qualifying market in this report grew faster over the full 2020–2025 period than Lakeland–Winter Haven.
Population increased approximately 19.8% in five years and another 2.7% between 2024 and 2025.
Current employment growth is more moderate at 1.4%, but still clears our threshold.
Lakeland’s location between Tampa and Orlando helps explain part of its demographic appeal. It can serve households and employers connected to more than one major Central Florida economic center while maintaining a different housing-cost profile from the larger metros.
For investors, however, Florida ownership expenses need to be considered alongside the population numbers.
Insurance, taxes, property condition and new construction can materially affect the return even when demand is expanding quickly.
5. Austin, Texas
Austin remains one of the country’s strongest long-term demographic growth markets even after its housing market cooled.
Census estimates show the metro population growing approximately 2.1% in the latest year and 13.9% since 2020.
BLS reported 1.9% payroll employment growth through June 2026.
That matters because Austin’s housing story has changed considerably from the shortage-driven environment earlier in the decade. Homebuilding and apartment development expanded aggressively, giving buyers and renters more alternatives.
For investors, Austin demonstrates why the best real estate markets for population and job growth should not automatically be called the best markets for immediate cash flow.
Demand fundamentals remain strong. Supply and acquisition price determine how much of that growth reaches an individual property’s bottom line.
6. Huntsville, Alabama
Huntsville has quietly accumulated one of the stronger demographic records among midsized U.S. metros.
Population increased approximately 2.6% from 2024 to 2025 and 12.5% since 2020.
Employment grew 1.3% over the latest year.
The market’s aerospace, defense, engineering and technology employment base gives Huntsville a different economic profile from many fast-growing southern markets centered primarily on population migration.
Its 2025 metro population exceeded 550,000, putting it comfortably above our minimum while remaining far smaller than Dallas, Houston or Phoenix.
That scale can create opportunity, but smaller markets can also have less depth if a major employer or industry weakens.
Review employer concentration alongside the attractive growth figures.
7. Charlotte, North Carolina-South Carolina
Charlotte combines scale with continued expansion.
Its metropolitan population approached 3 million in 2025 after growing approximately 1.9% in one year and more than 10% since 2020.
BLS reported 1.6% employment growth through June.
Charlotte’s economic base spans financial services, professional employment, logistics and a growing corporate presence, giving investors several potential sources of housing demand.
Its size is also an advantage. A larger metro provides more neighborhoods, price points and rental submarkets than a smaller growth center.
That makes metro-level numbers less useful at the property-selection stage, however.
An investor evaluating Charlotte should move quickly from regional growth data to neighborhood-level supply, rent and acquisition pricing.
8. Greenville, South Carolina
Greenville makes the ranking because job growth is running faster than its already solid population increase.
The metro grew roughly 1.4% from 2024 to 2025 and about 9% since 2020.
BLS reported 2.0% year-over-year employment growth.
That balance gives Greenville a different profile from markets where recent population growth substantially exceeds job creation.
The region’s manufacturing, logistics and professional employment base can support residential demand, but those sectors also expose the market to broader economic cycles.
For investors, Greenville is a reminder that the largest metros do not necessarily have the strongest growth combination.
Secondary markets can qualify on the same objective measures when the data support them.
9. Boise, Idaho
Boise remains a fast-growing population market even though its employment expansion has moderated.
Population increased approximately 2.2% over the latest year and 12.2% since 2020.
BLS reported 1.2% job growth, enough to qualify but noticeably slower than Fayetteville, Raleigh or Provo.
That gap deserves attention.
Population can continue increasing because of retirees, remote workers, migration patterns or other factors that do not translate directly into local payroll growth.
Housing prices also increased substantially during Boise’s earlier growth phase.
Investors should therefore compare today’s rent-to-price relationship with the demographic story rather than relying on the reputation Boise developed earlier in the decade.
10. Nashville, Tennessee
Nashville’s population and employment are currently growing at nearly the same pace.
Population increased approximately 1.6% between 2024 and 2025, while BLS reported 1.6% payroll growth through June 2026.
The metro has expanded about 8.7% since 2020.
Nashville has a diversified employment base spanning health care, professional services, tourism, entertainment and corporate operations.
Its continuing growth is meaningful, but the market also experienced substantial housing development as builders responded to years of migration.
That makes supply particularly important to your analysis.
Strong population numbers can support demand while new homes and apartments simultaneously reduce pricing power for existing owners.
11. Orlando, Florida
Orlando’s population has expanded approximately 10.3% since 2020, including another 1.3% in the latest Census year.
Payroll employment increased 1.4% through June 2026.
The metro is large enough that its economy extends well beyond tourism, although leisure and hospitality remain important.
For residential investors, Orlando’s economic growth has to be considered alongside an active housing-construction environment and the higher operating-cost issues affecting Florida property owners.
Property strategy matters too.
A conventional long-term rental and a property exposed to tourist demand should not be underwritten as though they serve the same market.
Population and job growth establish a demand backdrop. They do not determine the operating model.
12. Dallas–Fort Worth, Texas
Dallas-Fort Worth added more residents in absolute terms than most markets could ever match, but this ranking is based on rates rather than size alone.
The metro’s population reached approximately 8.5 million in 2025, up about 1.5% over the latest year and 10.6% since 2020.
The Census Bureau has separately highlighted the extensive population expansion occurring around the outer edges of the Dallas metro.
BLS reported 1.3% employment growth, equivalent to roughly 54,600 additional payroll jobs year over year—the largest numeric employment gain among U.S. metros in the June release.
Scale is Dallas-Fort Worth’s advantage and complication.
Housing conditions in one suburb can bear little resemblance to another. Investors should treat DFW as a collection of submarkets rather than one unified rental market.
13. Houston, Texas
Houston combines substantial population gains with more moderate current employment growth.
Census estimates show population increasing approximately 1.6% over the latest year and more than 10% since 2020.
BLS reported 1.1% payroll growth through June 2026.
That leaves Houston comfortably inside the qualifying group, although its current employment expansion is slower than most markets ranked above it.
For investors, Houston’s scale and comparatively broad housing inventory create opportunities across numerous price points.
The expense side can be challenging.
Property taxes, insurance and flood exposure can materially change operating income, while continued homebuilding can affect both rental competition and resale conditions.
Strong demographic growth should be viewed alongside those costs rather than instead of them.
14. Omaha, Nebraska-Iowa
Omaha is the least obvious market on the list, which is one reason it is worth including.
The metropolitan population moved above 1 million residents and grew approximately 0.96% from 2024 to 2025, which rounds to 1.0% using the one-decimal methodology applied in this report.
Its longer-term population increase is more modest at approximately 4.2% since 2020.
Employment tells a stronger current story.
BLS reported 1.6% payroll growth, matching larger growth markets such as Charlotte and Nashville.
Omaha therefore qualifies less because of dramatic migration and more because population expansion is accompanied by a healthy current employment signal.
That makes it an interesting counterweight to the faster-growing Sun Belt metros.
15. Phoenix, Arizona
Phoenix remains a significant growth market, but its position near the bottom of this particular ranking reflects slower recent population expansion.
Population increased approximately 1.1% over the latest year and 7.3% since 2020.
Employment grew 1.4% through June 2026.
Those figures are still positive and meet every qualification threshold.
They simply lag the rates recorded by many of the markets above.
Phoenix also added enormous amounts of housing during its previous expansion. That additional supply has helped shift acquisition conditions toward buyers and slowed parts of the rental market.
For an investor, that may not be negative.
A market can become easier to buy in at the same time its population and job base continue expanding. The important question is whether the individual property’s numbers have improved enough to justify the investment.
Strong Growth Markets That Did Not Make the Cut
A rules-based methodology becomes more useful when it excludes recognizable markets rather than finding a reason to include every popular city.
Las Vegas provides the clearest example. BLS reported exceptional 2.9% employment growth, but its latest population increase falls just below the report’s approximately 1% demographic threshold.
Salt Lake City also has very strong employment growth but slower recent population expansion than required here.
Other familiar Sun Belt markets fail on the employment side.
Jacksonville continues to add residents, but current payroll growth is much weaker. San Antonio’s population continues expanding while employment growth remains below our 1% cutoff. Atlanta also falls short on the current job-growth measure despite its size and long-term demographic appeal.
Those markets may still offer attractive investments.
They simply do not meet the specific population-and-employment test used for this report.
Why Housing Supply Can Change the Growth Story
More people plus more jobs generally increases housing demand.
But demand is only one side of the market.
If builders add homes and apartments as quickly as households are forming, tenants and buyers gain choices. Rent growth can slow even while the metro economy continues expanding.
The Census Bureau Building Permits Survey publishes current residential permit data by Core Based Statistical Area, giving investors a way to compare housing construction with local growth.
That step is particularly important in fast-building Sun Belt markets.
Austin, Dallas-Fort Worth, Houston, Nashville, Phoenix and other high-growth metros attracted extensive residential development as their populations expanded earlier in the decade.
Strong demand plus constrained supply creates a different investment environment from strong demand plus abundant new construction.
Neither is automatically better. Your acquisition price and strategy determine which works for you.
Population Growth Does Not Always Mean Rent Growth
Another mistake is assuming every new resident immediately produces higher rental income.
Households can move into newly built apartments. Existing renters can become homeowners. Developers can deliver enough units to give tenants negotiating leverage.
You can monitor that relationship using measures such as Zillow’s Observed Rent Index and Home Value Index, which provide standardized metro-level rent and home-value data.
The distinction is especially important when comparing markets.
A city with 2% population growth and flat rents tells you something different from a city where population, employment and rents are all rising together.
Before making an acquisition, compare the demographic signal with:
- Current market rent
- Rent growth
- Home values or purchase prices
- New construction
- Vacancy
- Property taxes
- Insurance
- Local employment concentration
- Property management costs
- Landlord-tenant regulation
The best real estate markets on a population-and-jobs screen should narrow your research, not replace it.
Why Sustained Growth Matters
One year can be noisy.
A large corporate relocation, temporary surge in migration or rebound from an unusually weak year can make a single annual percentage look impressive.
That is why this ranking also gives weight to population growth since 2020.
Lakeland has grown almost 20% over that period. Provo is above 14%. Austin is close to 14%, while Fayetteville, Raleigh, Huntsville and Boise have all expanded more than 12%.
Those are not one-year anomalies.
Sustained growth suggests that housing demand has been building over multiple years.
The tradeoff is that sellers, developers and other investors have had time to notice the same trend.
A market with excellent demographics may already have expensive housing or significant new supply.
Growth tells you where demand is developing. Price tells you whether you can participate profitably.
Growth Creates Demand, Not Automatic Returns
The best real estate markets for population and job growth in 2026 are not all the same type of place.
Northwest Arkansas leads because population and employment are both expanding rapidly. Raleigh combines similar strength with a much larger economic base. Provo and Austin pair years of demographic growth with continued job creation.
Lakeland and Huntsville stand out for exceptionally strong population gains. Charlotte and Nashville offer larger, diversified economies. Greenville demonstrates the potential of a secondary market with strong job growth, while Omaha qualifies for almost the opposite reason: moderate population growth supported by a healthier employment trend.
The data also show why investors should resist outdated market narratives.
A city that was one of the country’s fastest-growing housing markets three years ago may no longer have the same job-growth advantage. Another metro rarely featured on national investment lists may now have stronger fundamentals.
Use population growth to identify where housing demand may be expanding.
Use employment growth to determine whether the local economy is expanding with it.
Then examine supply, rents, acquisition costs and operating expenses before deciding whether that growth creates an investment opportunity for you.
A growing market can improve the odds of long-term housing demand.
The property still has to work on its own.