
Where Home Values Are Falling but Rents Are Rising in 2026
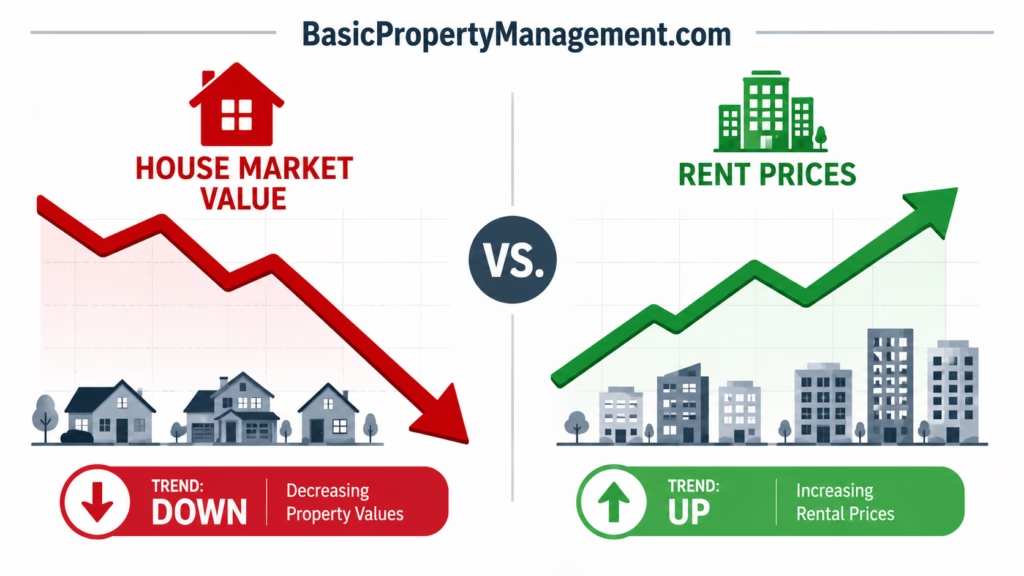
A lower home value does not necessarily create a better rental investment. Neither does a higher rent.
Put the two together, however, and the numbers become more interesting.
In eight major U.S. metropolitan markets, home values are falling but rents are rising by at least 1% year over year. That means the ownership side of the market is moving in one direction while the rental side moves in the other.
For a real estate investor, that divergence deserves attention.
Nationally, Zillow reported typical home values 1.1% higher year over year in July 2026, while typical rents increased 2.3%. These eight metros run against the national home-value trend while still producing meaningful rent growth.
The result can be an improving rent-to-value relationship: you may be buying into a market at a lower typical property value while market rent is moving higher.
That is not the same as an improving cap rate. Taxes, insurance, vacancy, maintenance, financing and property-specific rent still determine whether the investment works.
But it gives you a useful place to start looking.
Learn How Successful Landlords Manage Better Rentals
Join our 2X weekly newsletter for clear, actionable guidance on property management, leasing, tenant issues, rental property operations, and real estate investing strategies you can actually use.
How We Found the Markets
The ranking comes from Zillow’s July 2026 Market Report, using the 50 largest metropolitan markets in its dataset.
A metro had to meet two conditions:
- Zillow Home Value Index, or ZHVI, was negative year over year
- Zillow Observed Rent Index, or ZORI, increased at least 1.0% year over year
We then ranked the qualifying markets by the difference between rent growth and home-value change.
For example, if home values declined 1% and rent increased 2%, the divergence is three percentage points.
This is deliberately different from comparing median sale prices with median advertised rents. Zillow describes ZHVI as a measure of the typical home value across the housing stock, while ZORI is a repeat-rent index weighted to represent the rental market rather than only the properties currently advertised.
That gives us a more consistent comparison of the two market trends.
Eight Markets Moving in Opposite Directions
| Market | Typical Home Value | Home Value YoY | Typical Rent | Rent YoY | Divergence |
|---|---|---|---|---|---|
| San Jose, CA | $1,569,703 | -0.4% | $3,782 | +7.0% | 7.4 pts |
| Atlanta, GA | $381,578 | -1.5% | $1,855 | +2.1% | 3.6 pts |
| Pittsburgh, PA | $231,278 | -0.2% | $1,499 | +3.4% | 3.6 pts |
| Seattle, WA | $741,028 | -1.5% | $2,282 | +1.4% | 2.9 pts |
| Riverside, CA | $586,925 | -0.1% | $2,547 | +2.5% | 2.6 pts |
| Sacramento, CA | $582,570 | -0.3% | $2,296 | +1.7% | 2.0 pts |
| Jacksonville, FL | $352,756 | -0.4% | $1,711 | +1.4% | 1.8 pts |
| Miami, FL | $478,760 | -0.2% | $2,677 | +1.4% | 1.6 pts |
Source: Zillow July 2026 Market Report. Divergence equals annual rent growth minus annual home-value change.
San Jose, California: The Largest Gap by Far
San Jose is the clear outlier.
Zillow reported a typical home value of approximately $1.57 million, down 0.4% year over year, while typical rent reached $3,782, up 7.0%.
That creates a 7.4-percentage-point divergence—more than twice the gap in any other qualifying market.
Separate July data from Realtor.com also show softer conditions on the ownership side. Median listing price was down 2.0%, while asking price per square foot fell 3.7%.
That does not make San Jose an obvious cash-flow market.
In fact, its exceptionally high home values illustrate one of the most important cautions in this report. Rapid rent growth cannot automatically overcome a very high acquisition price.
A $3,782 typical rent sounds substantial until you compare it with a typical property value above $1.5 million.
San Jose earns first place because the direction of the two indexes has diverged dramatically—not because it necessarily offers the strongest rental yield.
Atlanta, Georgia: A More Investor-Relevant Price Reset
Atlanta presents a considerably different proposition.
Typical home value declined 1.5% year over year to approximately $381,578, while typical rent increased 2.1% to $1,855.
The resulting 3.6-point divergence ties Pittsburgh for second place.
Atlanta may be more relevant to a conventional residential investor because its entry price is dramatically lower than San Jose’s.
The secondary housing data are more nuanced. Realtor.com’s median July list price actually increased 1.2% year over year, although price per square foot was essentially flat at -0.1%. Nearly one-quarter of active listings had received a price reduction.
That difference between Zillow and Realtor.com is useful rather than problematic.
ZHVI measures changes in estimated typical home values across the broader housing stock. Realtor.com measures the homes currently being advertised for sale. The two can move differently when the mix of homes coming to market changes.
For you as an investor, the takeaway is not that Atlanta homes are uniformly getting cheaper. It is that Zillow’s broader value measure is declining while rental-market pricing continues to move upward.
That deserves property-level investigation.
Pittsburgh, Pennsylvania: Moderate Rents With a Low Entry Value
Pittsburgh produces the same 3.6-point divergence as Atlanta but gets there differently.
Typical home value is approximately $231,278, by far the lowest among the eight markets, and was down a modest 0.2% year over year.
Typical rent increased 3.4% to $1,499.
That combination may immediately catch the attention of income-focused investors because the broad home-value-to-rent relationship looks very different from San Jose or Seattle.
However, secondary pricing measures send a mixed signal.
Realtor.com reported July asking prices 2.2% higher year over year and price per square foot up 2.0%. Active inventory was also 16.2% above the previous year.
In other words, Zillow’s typical value measure is slightly negative while the homes currently listed on Realtor.com are asking more than a year ago.
That is exactly why you should not treat a metro ranking as a substitute for comparable sales.
Pittsburgh makes this list based on a valid Zillow value-and-rent divergence. Your actual acquisition may not be cheaper than it would have been a year ago.
Seattle, Washington: Softer Values and Much More Inventory
Seattle offers one of the clearer acquisition-side signals.
Zillow reports typical home value at approximately $741,028, down 1.5% year over year. Typical rent increased 1.4% to $2,282.
That creates a 2.9-point divergence.
Realtor.com’s July data reinforce the softer for-sale market. Median asking prices were down 1.3%, while asking price per square foot declined 2.2%.
More importantly, active inventory increased 21.4% year over year, and homes were taking about five days longer to sell.
More inventory can give you time to compare properties, inspect carefully and negotiate without the urgency created by severe housing scarcity.
Seattle’s purchase prices remain high, so the rent-to-price calculation still presents a hurdle for many conventional landlords.
The opportunity, if one exists, comes from the combination of greater buyer choice and continued rent growth—not from rent growth alone.
Riverside, California: Rents Rise While Values Edge Lower
The Riverside-San Bernardino market shows only a slight decline in Zillow home values, but rents are moving more decisively.
Typical home value fell 0.1% to approximately $586,925, while typical rent increased 2.5% to $2,547.
That creates a 2.6-point spread.
Realtor.com provides some additional confirmation on pricing. Its July median asking price was down 1.2% year over year, while price per square foot declined 1.5%.
Inventory, however, fell 6.1%.
That combination is worth noting because falling values are not always caused by a flood of homes entering the market. Local affordability, financing costs and shifts in buyer demand can affect values even when the number of active listings declines.
Riverside’s rent level is relatively high, but so is its acquisition cost.
As with the other California markets, calculate the return from the property you can actually buy rather than assuming strong metro rent growth creates an attractive yield.
Sacramento, California: A Genuine Divergence With a Mixed Price Signal
Sacramento’s typical Zillow home value was approximately $582,570 in July, down 0.3% year over year.
Typical rent reached $2,296, up 1.7%.
The two-point divergence meets our screen, but Sacramento also provides another reason to use more than one housing measure before making an investment decision.
Realtor.com’s July median asking price was essentially unchanged from the previous year, while asking price per square foot increased 0.3%.
Active listings fell 6.6%.
So while Zillow shows typical values edging lower, current sellers are not necessarily listing properties more cheaply.
For an investor, Sacramento is less compelling as a broad “falling prices” story than Seattle or Atlanta.
It still qualifies because the Zillow measures are moving in opposite directions. That makes the rental-versus-value relationship worth monitoring, particularly if individual sellers begin showing more flexibility than the broader asking-price statistics suggest.
Jacksonville, Florida: Lower Asking Prices Strengthen the Signal
Jacksonville has one of the lowest typical home values on the list.
Zillow reported approximately $352,756, down 0.4% year over year, while typical rent increased 1.4% to $1,711.
The resulting divergence is 1.8 percentage points.
Realtor.com’s July statistics make the acquisition side more interesting. Median list price was down 4.5% year over year, while price per square foot declined 3%.
More than one-quarter of active listings had received a price reduction.
Yet Jacksonville’s inventory was actually down 20% from the previous July, and homes were selling faster.
That combination is important because it argues against a simplistic explanation that prices are declining only because the market has too many homes for sale.
Florida investors also need to put insurance near the top of the underwriting worksheet.
A cheaper acquisition combined with slightly higher rent can look appealing until higher insurance, taxes or maintenance consume the improvement.
Miami, Florida: A Small Divergence With Large Operating Questions
Miami completes the screen with typical home values down 0.2% and rent up 1.4%.
Zillow’s typical home value was approximately $478,760, while typical rent reached $2,677.
The 1.6-point divergence is the smallest among the eight qualifying markets, but Realtor.com’s data provide additional evidence of price softening.
July median asking price fell 2.9%, while price per square foot declined 1%.
At the same time, active listings were down almost 17% from a year earlier.
Miami therefore shares something with Jacksonville: values and current asking prices are softer despite shrinking inventory.
For an investor, the expense side deserves at least as much attention as the rent side.
Insurance, condominium assessments, HOA charges and property-specific exposure can alter net operating income substantially. A 1.4% increase in market rent is relatively small compared with a significant increase in one of those expenses.
Miami qualifies statistically. Whether the divergence creates a usable investment opportunity depends heavily on property type.
Why Austin Does Not Make the List
Austin provides a useful control case.
If falling property values were all we cared about, Austin would rank near the top of the discussion.
Zillow reported typical home values down 4.5% year over year in July—far more than any of the eight qualifying markets.
But typical rent was also down 0.9%.
That means both sides of the equation are moving lower.
Las Vegas presents a less dramatic version of the same issue: home values declined 2.8%, but rent growth was only 0.2%, below our 1% requirement.
These exclusions are important.
The purpose of this report is not to find cities where homes have become cheaper. It is to identify markets where home values are falling but rents are rising enough to create a meaningful divergence between acquisition values and rental pricing.
What the Divergence Does to the Rent-to-Value Relationship
The basic concept is straightforward.
Imagine a market where a typical property is worth $400,000 and supports $2,000 in monthly rent.
Annualized gross rent is $24,000.
Now suppose the typical property value declines to $392,000 while market rent increases to $2,050.
Annualized rent becomes $24,600 while the asset value is lower.
The broad gross rent-to-value relationship has improved.
But that calculation still tells you almost nothing about the property’s actual return.
It does not include:
- Property taxes
- Insurance
- Vacancy
- Repairs
- Capital expenditures
- Property management
- HOA expenses
- Utilities paid by the owner
- Financing costs
- Closing and renovation expenses
For that reason, you should not describe the Zillow divergence as cap-rate expansion.
Treat it as an investment screening signal.
It tells you that rental pricing and property values are moving in a direction worth investigating. Your underwriting determines whether any of that improvement reaches cash flow.
When the Divergence Supports a Value-Add Strategy
A market where home values are softening while rents are rising can be especially interesting if you are evaluating properties that need renovation or operational improvement.
The opportunity is not simply to buy at a lower price. A stronger value-add deal depends on whether you can acquire the property at a workable basis, improve it economically, achieve a realistic post-renovation rent and still support the financing and refinance assumptions.
If that approach fits your investment strategy, BRRRR and More covers the Buy, Rehab, Rent, Refinance, Repeat framework along with related ways to evaluate and build a real estate investment portfolio.
The important point is that a favorable market-level rent-to-value trend can improve the backdrop for a BRRRR-style investment, but the individual property’s rehabilitation costs, stabilized value, achievable rent and refinance terms still determine whether the deal works.
Asking Rent Is Not Always Effective Rent
There is another important qualification on the rental side.
Zillow reported that 39.8% of rental listings offered some form of concession in July 2026.
That can include a free month, reduced deposit or other incentive.
A property advertised at $2,000 per month with one month free on a 12-month lease does not economically produce $24,000 in first-year rent. The concession lowers the effective rent received.
That means you should compare:
Asking rent: What landlords advertise.
Effective rent: What the lease actually produces after concessions.
Achieved rent: What comparable properties are successfully leasing for in the submarket.
The distinction becomes particularly important in markets with substantial new apartment construction.
Zillow’s June 2026 rental analysis found another important split: single-family rents were up 3.0% nationally, roughly twice the 1.5% increase for multifamily rentals.
If you are buying a single-family rental, a metro-wide rent index influenced by apartments may not tell you exactly how your property segment is performing.
Move from the metro data to comparable rentals before finalizing your projections.
Different Price Measures Can Disagree Without Either Being Wrong
Several markets in this report show Zillow home values declining while Realtor.com asking prices are stable or increasing.
Pittsburgh is the clearest example.
That is not necessarily a contradiction.
ZHVI seeks to measure changes in the value of the broader housing stock. Realtor.com’s listing data measure homes owners are currently offering for sale.
Suppose more high-end properties enter the market this year than last year.
The median list price can rise because the mix of available homes changed even while the underlying value of comparable properties is flat or falling.
The opposite can happen too.
For investors, this is why relying on one metric can lead you in the wrong direction.
Use broad indexes to find markets worth investigating. Then use recent comparable sales, current listings, rent comps and property-specific financial analysis to decide what an individual asset is worth.
Falling Values and Rising Rents Create an Opening—not an Answer
Markets where home values are falling but rents are rising offer an appealing investment premise.
You may be able to acquire a property against a softer value environment while rental pricing moves in the opposite direction.
San Jose shows the largest divergence, driven primarily by exceptional rent growth. Atlanta combines a more meaningful decline in typical home value with moderate rent growth. Pittsburgh offers a much lower typical acquisition value, although other pricing measures remain firm.
Seattle adds substantially more for-sale inventory to the equation. Riverside and Sacramento show smaller California divergences. Jacksonville and Miami demonstrate that values can soften even as available inventory declines.
No single explanation applies to all eight.
That is why the divergence is best used as a screen rather than a conclusion.
If home values are falling but rents are rising in a market you are considering, ask what is driving each side of that relationship. Determine whether the trend applies to the neighborhood and property type you intend to buy. Verify the achievable rent, then build in realistic expenses.
Most importantly, do not assume either trend continues indefinitely.
A lower value can improve your acquisition basis. Higher rent can improve revenue.
The investment only works when those advantages survive the rest of the underwriting.