
Manufactured Housing Market 2026: Supply, Rents and Demand
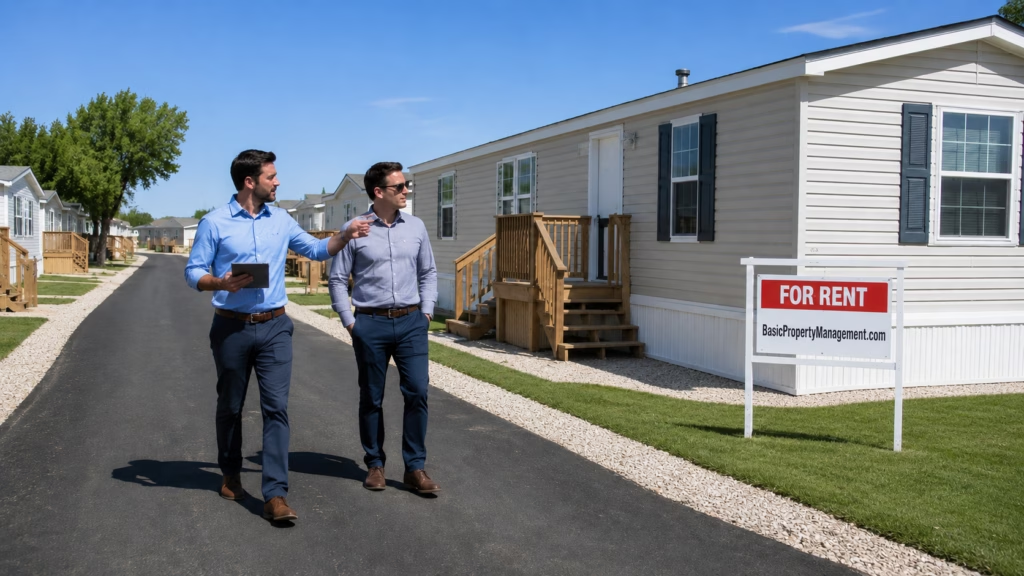
Manufactured housing entered 2026 with several trends moving in different directions. New-home shipments are running below last year’s pace, the average price of a new manufactured home increased in 2025, and more homes were placed in land-leased manufactured housing communities. At the property level, two large publicly traded community operators continue to report higher site rents, although their occupancy results differ.
That makes the manufactured housing market 2026 more useful to evaluate through several measures rather than one headline number.
The distinction matters if you invest in manufactured housing communities, still commonly called mobile home parks. The U.S. Census Bureau’s Manufactured Housing Survey, conducted with HUD, tracks new manufactured homes through shipments, placements, prices, size, and other characteristics. It does not measure the operating performance of every manufactured housing community in the country.
To add a property-level view, this report also looks at operating results filed with the SEC by Equity LifeStyle Properties and UMH Properties. Those results provide useful examples of current community performance, but they represent the companies’ portfolios rather than national averages.
Take Your Real Estate Business to the Next Level
Sign up for our 2X weekly newsletter and receive useful tips on property management, rental property investing, landlord best practices, and tools that help you manage smarter.
Manufactured Housing Market 2026 at a Glance
| Metric | Latest reading | Comparison |
|---|---|---|
| U.S. manufactured-home shipments | 50,400, Jan.–June 2026 | 53,800 in Jan.–June 2025 |
| Full-year U.S. shipments | 102,700 in 2025 | 103,300 in 2024 |
| Average new manufactured-home price | $127,200 in 2025 | $123,300 in 2024 |
| Homes placed in land-leased MHCs | 18,700 in 2025 | 15,300 in 2024 |
| ELS Core MH occupancy | 93.8% in Q2 2026 | 94.3% in Q2 2025 |
| UMH same-property occupancy | 89.4% in Q2 2026 | 88.3% in Q2 2025 |
The national data point to a market where factory shipments have eased, yet community-level performance has not weakened in the same way. Rent growth remains visible in major public portfolios, while 2025 placement data show more newly sold homes moving into land-leased communities.
New Manufactured Home Shipments Have Slowed
Manufacturers shipped approximately 50,400 new homes during the first six months of 2026, according to Census data. That compares with about 53,800 during the same period in 2025, a decline of roughly 6%.
Full-year 2025 shipments totaled approximately 102,700 homes, slightly below the 103,300 shipped in 2024. June 2026 shipments were about 8,900 units, following 8,400 in May and 9,200 in April. Census identifies April and May as revised estimates and June as preliminary.
A decline in shipments should not be read as a manufactured housing community vacancy statistic.
Shipment data track homes leaving manufacturers and entering the distribution system. Census then follows sampled units to determine whether they were sold, placed for residential use, held in inventory, or moved into another status.
For an MHC investor, shipment numbers are most useful as a measure of new-home supply and geographic activity. Local occupancy, lot absorption, resident turnover, and home-sale velocity still need to be evaluated separately.
New Manufactured Home Prices Continued to Increase
Census annual data show an average U.S. sales price of $127,200 for a new manufactured home in 2025, up from $123,300 in 2024. That is an increase of approximately 3.2%.
The type of home makes a substantial difference. In 2025, the average price was approximately:
- $85,600 for a single-section home
- $157,100 for a multi-section home
These are not all-in development costs.
Census notes that dealer-reported prices include dealer setup costs, but some additional expenses required to make a home ready for occupancy may fall outside the reported sales price. Transportation, site preparation, utility work, pad improvements, permitting, skirting, stairs, landscaping, and other costs can materially change the final amount invested in a home.
That becomes especially important when you are evaluating a vacant-site infill strategy. A national average purchase price is a starting point, not a capital budget.
More New Homes Were Placed in Land-Leased Communities
One of the more useful 2025 findings appears in the annual Census placement data.
Approximately 18,700 new manufactured homes were sold and placed in land-leased manufactured housing communities during 2025, up from about 15,300 in 2024. That is an increase of roughly 22%.
The broader category of homes placed inside communities actually declined, from approximately 30,800 in 2024 to 26,600 in 2025. The change came from a sharp drop in homes placed on private property inside subdivisions or planned unit developments.
Placements specifically in land-leased manufactured housing communities moved in the opposite direction.
At the same time, about 44,100 new homes were placed outside communities in 2025, up from 36,900 a year earlier.
For someone analyzing MHC demand, the land-lease figure is more relevant than factory shipments alone because it tracks homes that were actually sold and placed in the type of community being evaluated.
It still does not tell you how those communities performed financially. The placement data do not provide lot rents, operating expenses, NOI, cap rates, or acquisition prices.
Manufactured Housing Markets by State
Manufactured housing activity remains heavily concentrated in the South. State shipment data show where new homes are moving and whether those markets are running ahead of or behind last year’s pace.
The state series currently runs through May 2026, one month behind the national shipment data. Census also reports annual average sales prices by state, which helps show how the cost and product mix differ from one market to another.
| State | 2025 shipments | Jan.–May 2026 | YoY change | 2025 avg. home price |
| Texas | 17,458 | 7,343 | -5.7% | $124,500 |
| Florida | 6,804 | 2,896 | +3.3% | $133,500 |
| North Carolina | 6,269 | 2,485 | -10.3% | $127,300 |
| Alabama | 5,314 | 2,333 | -3.6% | $115,900 |
| South Carolina | 5,232 | 2,223 | -7.0% | $141,000 |
| Georgia | 4,807 | 2,146 | +2.4% | $131,300 |
| Mississippi | 3,994 | 1,789 | -1.4% | $130,300 |
| Kentucky | 3,800 | 1,734 | +9.3% | $125,200 |
The average prices above represent new manufactured homes sold or intended for sale. They should not be confused with the combined cost of a home and land, nor should they be treated as the full cost of installing a home in an existing community.
The state numbers also do not measure MHC rent growth, vacancy, NOI, cap rates, or transaction pricing. They are useful for understanding manufactured-home activity, but they are only one part of a market analysis.
Texas: By Far the Largest Manufactured Housing Market
Texas remains in a category of its own when measured by shipment volume.
Manufacturers shipped 17,458 new manufactured homes to Texas in 2025, more than two and a half times Florida’s total. Texas accounted for roughly 17% of all U.S. manufactured-home shipments during the year.
Activity has eased in 2026. Through May, shipments totaled 7,343 homes, down from 7,785 during the same five months of 2025. That is a decline of approximately 5.7%.
The state’s product mix leans toward larger homes. About 61% of shipments through May 2026 were multi-section units, while 39% were single-section.
Texas had an average new manufactured-home price of $124,500 in 2025, up from $122,500 a year earlier. Single-section units averaged $87,300, while multi-section homes averaged $151,500.
The scale of the Texas market makes statewide averages especially difficult to apply to an individual acquisition. Houston, Dallas-Fort Worth, San Antonio, rural East Texas, and smaller regional markets can have very different lot rents, land costs, property taxes, utility systems, and competing supply.
High shipment volume confirms that manufactured housing plays a major role in the state. It does not tell you whether a particular community is well priced.
Florida: Shipments Are Growing Again in 2026
Florida was the second-largest destination among the states in this report, receiving 6,804 manufactured homes during 2025.
The state has started 2026 ahead of last year’s pace. Shipments reached 2,896 during January through May, compared with 2,803 during the same period in 2025. That is an increase of approximately 3.3%.
Florida also has one of the strongest preferences for multi-section homes in the group. Roughly 70% of shipments through May 2026 were multi-section units.
The average new manufactured-home price came in at $133,500 in 2025, slightly below $135,100 in 2024. Single-section homes averaged $90,100 and multi-section homes averaged $155,600.
Florida’s shipment growth is useful market context, but MHC underwriting in the state requires a much broader view. Insurance costs, storm exposure, land values, redevelopment pressure, resident demographics, and local regulation can have a larger effect on a property’s NOI than statewide shipment trends.
North Carolina: A Large Market Experiencing a 2026 Pullback
North Carolina remains one of the country’s more active manufactured-housing states, although shipments have slowed noticeably this year.
The state received 6,269 homes in 2025. Through May 2026, shipments fell to 2,485 from 2,769 during the comparable period in 2025, a decline of approximately 10.3%.
That is the largest year-over-year decrease among the eight states reviewed here.
Multi-section homes still account for the majority of activity, representing about 60% of current shipments.
Average pricing moved higher. New manufactured homes averaged $127,300 in 2025, compared with $125,200 in 2024. Single-section homes averaged $78,700 and multi-section units averaged $155,800.
Five months of lower shipments is not enough to conclude that North Carolina MHC fundamentals are weakening. Dealer inventories, consumer financing, factory orders, and the timing of placements can all affect monthly shipment figures.
A community-level conclusion would require evidence from local occupancy, resident demand, home sales, and vacant-site absorption.
Alabama: High Volume With a Balanced Product Mix
Alabama received 5,314 manufactured homes in 2025, placing it among the most active states in the country.
Through May 2026, shipments totaled 2,333 homes, down modestly from 2,420 during the same period last year. The decline was approximately 3.6%.
Alabama differs from several neighboring states in its product mix. Current shipments are almost evenly divided between single-section and multi-section homes.
The state also recorded the lowest average new-home price among the eight markets in this report. The 2025 average was $115,900, up from $112,200 a year earlier. Single-section units averaged $83,800 and multi-section homes averaged $157,900.
The lower statewide average reinforces manufactured housing’s affordability role in Alabama, but it should not be used as a proxy for MHC acquisition pricing. The value of an operating community depends on its rents, occupancy, expenses, infrastructure, location, and income-producing potential.
South Carolina: High Activity Despite Lower 2026 Shipments
South Carolina received 5,232 manufactured homes in 2025, nearly matching Alabama despite having a smaller population.
Shipments have moved lower this year. Through May 2026, the state received 2,223 homes, down from 2,390 during the same period in 2025. That represents a decline of approximately 7.0%.
Multi-section homes account for about 66% of current shipments.
South Carolina also recorded the highest average 2025 manufactured-home price among these eight states at $141,000, up from $136,700 in 2024. Single-section homes averaged $91,100, while multi-section units averaged $162,300.
The gap between South Carolina and lower-cost states such as Alabama shows why a national home-price assumption can be misleading. Anyone budgeting for vacant-site infill should use current dealer quotes, delivery costs, and site-specific installation expenses rather than relying on the national average.
Georgia: Shipment Growth Continues
Georgia is one of the few large manufactured-housing states in this group where 2026 shipments are currently ahead of last year’s pace.
The state received 4,807 homes during 2025, up from 4,601 in 2024. Through May 2026, shipments reached 2,146, compared with 2,096 a year earlier. That is an increase of about 2.4%.
Multi-section units account for approximately 69% of current shipments.
Average pricing has increased more quickly. New manufactured homes averaged $131,300 in 2025, up from $124,800 in 2024. That works out to an increase of approximately 5.2%. Single-section homes averaged $82,800 and multi-section units averaged $155,400.
For communities with vacant sites, that combination deserves attention. Filling additional lots can increase revenue, but higher home acquisition and installation costs can change the economics of an infill program.
The relevant calculation is not simply how many homes can be added. It is how much capital each occupied site requires and how much additional NOI it can produce.
Mississippi: Shipments Are Stable, but Average Prices Jumped
Mississippi’s shipment volume has changed very little.
Manufacturers shipped 3,994 homes to the state in 2025, slightly above the 3,929 recorded in 2024. Through May 2026, shipments totaled 1,789 homes, compared with 1,815 a year earlier, a decline of only 1.4%.
Mississippi also differs from several nearby states because single-section units still represent a slight majority of current shipments. About 52% of shipments through May 2026 were single-section homes.
Pricing moved more sharply than shipment volume. The average new manufactured-home price increased from $121,600 in 2024 to $130,300 in 2025, or about 7.2%.
Single-section homes averaged $82,200, while multi-section units averaged $154,400.
For an infill strategy, that increase matters. If home costs rise faster than the revenue available from an occupied site, returns can narrow even when demand remains healthy.
Kentucky: The Strongest 2026 Shipment Growth of the Group
Kentucky currently has the fastest shipment growth among the eight states examined.
The state received 3,800 manufactured homes in 2025. Through May 2026, shipments reached 1,734, up from 1,587 during the same period a year earlier. That represents an increase of approximately 9.3%.
About 59% of current shipments are multi-section homes.
Kentucky also recorded the largest increase in average home pricing among the group. The statewide average rose from $112,100 in 2024 to $125,200 in 2025, an increase of about 11.7%.
Single-section homes averaged $81,500, while multi-section units averaged $152,500.
Rising shipments and higher home prices make Kentucky worth watching through the rest of 2026. Whether those trends create attractive MHC investment opportunities still depends on what is happening at the local level.
Lot rents, occupancy, competing communities, resident turnover, household growth, infrastructure costs, and acquisition pricing remain the numbers that determine the property-level result.
What the State Comparisons Tell Investors
The eight-state comparison shows how much can be hidden inside a national average.
Texas remains the clear scale leader, even with slower shipments this year. Florida and Georgia are running modestly ahead of their 2025 shipment pace, while Kentucky has the strongest year-over-year growth. North Carolina currently shows the largest decline.
Product mix varies too. Florida and Georgia receive far more multi-section than single-section homes. Alabama is almost evenly split, while Mississippi continues to receive slightly more single-section units.
Pricing tells another story. Alabama had the lowest average new-home price of the group at $115,900, while South Carolina averaged $141,000. Kentucky and Mississippi recorded some of the largest year-over-year price increases.
These differences can affect the economics of community expansion and vacant-site infill. The number and type of homes being delivered influence how much capital may be required to add occupied sites.
What the Census data cannot tell you is whether Texas, Florida, Kentucky, or any other state offers the best MHC investment returns.
There is no comparable federal state-level series for community lot rents, NOI, economic vacancy, cap rates, or transaction pricing. State shipment data should therefore be treated as one layer of the market analysis rather than as a ranking of the best places to invest.
Public MHC Operators Show Rent Growth, but Occupancy Is Mixed
Government data provide a strong view of manufactured-home production and placement. To understand current community operations, public-company filings offer another useful source of evidence.
The results from Equity LifeStyle Properties and UMH Properties also show why one rent or occupancy statistic cannot describe the entire market.
Equity LifeStyle: Higher Site Revenue With Expansion Affecting Occupancy
In its second-quarter 2026 SEC filing, Equity LifeStyle Properties reported 93.8% average occupancy in its Core manufactured housing portfolio, compared with 94.3% in Q2 2025.
The company attributed most of the year-over-year decline to 503 expansion sites added since June 2025. Occupied sites still increased by 13 between the first and second quarters of 2026.
Average monthly MH base rental income per site increased to approximately $956 from $904 a year earlier. Core MH base rental income rose 5.8%.
Expenses also moved higher. Equity LifeStyle reported a 2.9% increase in Core Portfolio operating expenses, excluding property management, driven largely by utilities and repairs and maintenance.
The results show why an occupancy percentage needs context. Adding new sites can temporarily reduce the reported occupancy rate even while the number of occupied sites and rental income continue to rise.
UMH: Occupancy, Site Rent and NOI All Increased
UMH Properties reported a different operating pattern in its Q2 2026 supplemental filing.
Across 139 same-property communities, occupancy increased to 89.4% from 88.3%, a gain of 110 basis points.
Monthly rent per site rose 5.0% to $585 from $557.
Same-property rental and related income increased 8.1%, while community operating expenses increased 6.9%. The result was an 8.8% year-over-year increase in same-property community NOI during Q2.
UMH’s broader portfolio included 145 communities and 27,104 sites, including interests in three joint-venture communities, as of June 30, 2026.
The $956 ELS figure and $585 UMH figure should not be read as a direct market comparison. The portfolios differ in geography, community type, asset quality, property mix, and accounting presentation.
What is more useful is the direction of each company’s results. Both reported site-related rent growth of around 5% or better, while occupancy moved differently.
Manufactured Housing Still Plays a Large Role in Rural Housing
Manufactured housing is not only an investment property type. It remains an important part of the U.S. housing stock, especially outside major metropolitan areas.
A 2026 HUD USER analysis of rural housing reports that more than half of the approximately 6.7 million occupied manufactured homes in the United States are located in rural areas. Manufactured homes account for about 13% of occupied rural housing.
HUD also identifies zoning restrictions, financing complexity, and delivery challenges as barriers to wider use of manufactured housing.
Those issues matter at the property level. Strong national demand does not eliminate local zoning limits, utility constraints, infrastructure problems, or restrictions on adding homes and expanding a community.
Community Financing Has Its Own Requirements
Manufactured housing finance operates on two different levels.
A resident may need financing for the home itself. The community owner may need commercial financing for the land, sites, infrastructure, and income-producing real estate.
Manufactured housing is one of the underserved markets covered by the Federal Housing Finance Agency’s Duty to Serve program. FHFA’s current framework includes both single-family manufactured housing and multifamily manufactured housing community activity.
Fannie Mae also maintains a dedicated Manufactured Housing Community financing program. Eligible properties generally need to be existing, stabilized, professionally managed communities with at least 50 pad sites.
The financing is primarily secured by the community land, sites, and infrastructure rather than by resident-owned homes.
Qualifying communities must also adopt Tenant Site Lease Protections, including requirements involving renewable leases, notice of rent increases, and grace periods for late payments.
Ownership structure is therefore an important underwriting issue. In a traditional land-lease community, residents own their homes and rent the sites beneath them. A property with a large inventory of community-owned rental homes operates differently and can require more capital, maintenance, and management.
What Investors Should Track Through the Rest of 2026
Several measures deserve attention as the year progresses:
- Monthly national manufactured-home shipments
- State shipment trends
- New-home placement in land-leased communities
- Community occupancy
- Site-rent growth
- Expansion-site absorption
- Community operating expenses
- New manufactured-home pricing
- Changes in agency financing requirements
Operating expenses deserve as much attention as rent growth.
In Q2 2026, Equity LifeStyle reported a 2.9% increase in Core Portfolio operating expenses excluding property management. UMH’s same-property community operating expenses increased 6.9%.
Those results do not establish a national expense benchmark. They do show why an acquisition model should use the property’s actual utility costs, payroll, repairs, taxes, insurance, management expenses, and infrastructure needs rather than importing a generic industry ratio.
Local regulation also needs a separate review. Zoning, tenant protections, rent restrictions, utility regulation, title treatment, installation standards, and expansion rights can differ substantially by jurisdiction.
A national report establishes context. The acquisition decision still comes down to the local market and the individual property.
If you are evaluating a specific community, the framework discussed in Investment Real Estate Analysis: A Case Study can help separate broad market evidence from the assumptions used in property-level underwriting.
What the 2026 Data Actually Shows
The manufactured housing market 2026 is not moving in one direction.
New-home shipments slowed during the first half of the year after remaining nearly flat between 2024 and 2025. Average new-home prices increased in 2025.
At the same time, more newly sold homes were placed in land-leased manufactured housing communities. State data show continued concentration across Texas and the Southeast, but current shipment trends vary widely by state.
Public-company filings add another perspective. Major MHC operators continue to report higher site rents, yet their occupancy results are not identical. UMH posted higher same-property occupancy and NOI, while Equity LifeStyle continued to grow rental income even as newly added expansion sites affected its reported occupancy rate.
The data support continued attention to manufactured housing as a commercial real estate sector. They do not support the conclusion that every state, community, or acquisition shares the same outlook.
At the individual-property level, the deciding factors remain local site rents, physical and economic occupancy, resident-owned versus community-owned homes, operating expenses, utility structure, infrastructure condition, expansion potential, regulation, financing, and acquisition basis.
That is why this report does not publish a synthetic “national MHC cap rate” or label the highest-shipment states as the best places to invest. The available federal datasets do not provide comparable national or state-level MHC cap rates, transaction pricing, or property operating results.
Use national and state data to understand the setting. Then move down to the metro, the competing communities, and finally the property’s own financial statements.
For a manufactured housing investment, that last step is where the market story either holds up—or falls apart.