The 9 Strongest Retail Property Markets for 2026

Retail investors spent years preparing for physical stores to lose ground to e-commerce. In many of the strongest U.S. markets, the more immediate problem is now the opposite: expanding tenants cannot find enough well-located space.
That scarcity does not make every low-vacancy market attractive. New construction is rising in several fast-growth metros, store closures are creating uneven pockets of availability, AI is impacting office employment, and high purchase prices can leave little room for leasing costs, capital work, or weaker consumer spending.
This report identifies nine of the best retail real estate markets for 2026 by comparing vacancy, absorption, asking rents, construction, population growth, consumer demand, and investment risk. The rankings favor markets where tenant demand is broad, new supply remains supportable, and existing owners have a realistic opportunity to protect occupancy and grow income.
Get Practical Property Management Tips Twice a Week
Want smarter systems for managing rentals, screening tenants, handling maintenance, and improving property performance? Sign up for our 2X weekly newsletter and get practical property management and real estate investing insights delivered straight to your inbox.
Limited Construction Is Still Protecting Retail Owners
The national shopping center vacancy rate held at 6.0% during the second quarter of 2026, compared with a historical average of 7.4%. Net absorption returned to positive territory at approximately 708,000 square feet, and average asking rents increased 2.2% from a year earlier to $25.65 per square foot, according to the Cushman & Wakefield Q2 2026 U.S. Shopping Center MarketBeat.
The supply figures explain why landlords retain leverage in many desirable locations. Cushman & Wakefield tracked 13.3 million square feet under construction against nearly 4.2 billion square feet of shopping center inventory. The development pipeline represented less than 0.3% of existing stock. Neighborhood and strip centers accounted for 82% of second-quarter deliveries, reflecting continued demand for convenience-oriented retail.
Other research firms report different vacancy and absorption figures because their inventories include different types of retail property. The Colliers Q2 2026 national retail analysis placed vacancy at 4.4% and second-quarter absorption at 10.2 million square feet. Its coverage extends beyond shopping centers to freestanding buildings, restaurants, mixed-use retail, banks, pharmacies, dealerships, and other properties. The figures should not be combined as though they measure the same inventory, but both reports show limited availability and restrained construction.
The demand is not distributed equally among tenants. The CBRE 2026 retail outlook expects grocery-anchored centers, neighborhood and strip centers, and high-income suburban corridors to outperform. Grocery, discount, off-price, restaurant, and service-oriented tenants are expected to offset continued restraint among discretionary retailers. Weaker malls and older power centers face higher improvement costs and slower backfilling.
Online spending continues to expand. First-quarter 2026 e-commerce sales increased faster than total retail sales and represented approximately one-sixth of U.S. retail spending. That growth does not affect every property equally. Grocery stores, restaurants, medical providers, fitness operators, automotive services, and personal-service businesses face less direct online substitution than retailers selling products that are easily shipped.
Retail’s national advantage is therefore limited replacement supply, not immunity from risk. A strong center can benefit from tenants competing for space. A weak center can still lose occupancy because of poor access, obsolete layouts, excessive rents, deferred maintenance, or an unfavorable trade area.
How the Markets Were Evaluated
We used the same broad multi-factor approach applied in our top rental property markets for 2026, but adjusted the measures for retail property investment. The ranking was assembled from property-market, demographic, employment, consumer, and investment data. It was not copied from another list, and no single statistic determined a market’s position.
The principal comparative source was the Cushman & Wakefield Q2 2026 U.S. Shopping Center MarketBeat. It provides a consistent set of vacancy, absorption, asking-rent, inventory, delivery, and construction figures for more than 80 U.S. markets. Using one principal dataset reduces the risk of ranking one city with a broad retail inventory and another with a much narrower shopping center inventory.
Cushman & Wakefield’s coverage includes competitive community and neighborhood centers, power and regional centers, and strip centers. It excludes enclosed malls, outlet centers, themed retail centers, airport retail, and freestanding properties. Current-quarter figures are preliminary and may be revised.
We compared the principal dataset with broader national and local reports from Colliers, CBRE, Kidder Mathews, Matthews Real Estate Investment Services, Partners Real Estate, and other commercial real estate research firms. These reports were used to examine tenant demand, transactions, submarkets, construction, and differences among property formats. They were not mixed directly into the comparison chart when their inventory definitions differed from Cushman & Wakefield’s.
Population and migration were reviewed through the Census Bureau’s Vintage 2025 estimates. The data showed that population growth slowed in 310 of the country’s 387 metropolitan areas between July 2024 and July 2025. Earlier migration rates were therefore not assumed to continue indefinitely.
Employment conditions were checked using Bureau of Labor Statistics metropolitan data. Employment growth can support household income and daytime retail demand, but it does not substitute for property-level occupancy, tenant sales, or trade-area analysis.
The markets were evaluated across five broad categories:
- Property fundamentals — 35%. Vacancy, four-quarter absorption, rent movement, leasing conditions, and the ability to backfill vacated space.
- Supply conditions — 20%. Space under construction, recent deliveries, planned projects, and the pipeline relative to existing inventory.
- Demographic and economic demand — 20%. Population, household growth, employment, income, tourism where relevant, and the depth of the customer base.
- Investment conditions — 15%. Buyer interest, transaction liquidity, acquisition pricing, market scale, and financing considerations.
- Market risks — 10%. Excess development, high ownership costs, dependence on one industry, tenant concentration, insurance, taxes, and weak discretionary demand.
These weights guided the analysis, but the final order was not produced by a purely mechanical score. Commercial real estate datasets use different geographic boundaries and property definitions, and several important risks cannot be reduced to a dependable number. We also considered whether recent absorption appeared repeatable, whether construction was supported by occupied housing, and whether acquisition pricing left room for adverse conditions.
The 12-month absorption totals in the chart were calculated by adding the third and fourth quarters of 2025 and the first and second quarters of 2026. A four-quarter total reduces the effect of one unusually strong or weak quarter, although a major move-in or closure can still affect a smaller market materially.
These rankings should be treated as an initial market screen. Metro-wide data cannot determine whether a specific shopping center has the right tenants, leases, access, condition, financing, purchase price, or immediate customer base.
The 9 Best Retail Real Estate Markets for 2026
| Market | Vacancy | 12-Mo. Abs. | Why It Ranks | Key Risk |
|---|---|---|---|---|
| 1. Raleigh-Durham | 3.3% | +275K SF | Growth and low pipeline | Recent deliveries |
| 2. Austin | 4.2% | +749K SF | Demand and household growth | Heavy pipeline |
| 3. Charlotte | 3.9% | +96K SF | Rent and population growth | Uneven absorption |
| 4. Miami | 3.0% | −121K SF | Scarce space and high rents | High ownership costs |
| 5. Orange County | 4.0% | +390K SF | Tight supply and occupancy | High entry pricing |
| 6. Phoenix | 5.4% | +947K SF | Strong absorption | Substantial new supply |
| 7. Las Vegas | 5.2% | +764K SF | Leasing momentum | Tourism exposure |
| 8. Nashville | 3.6% | +83K SF | Low vacancy and supply | Softer recent demand |
| 9. Charleston | 3.8% | +155K SF | Low vacancy and pipeline | Limited liquidity |
The chart uses the same Cushman & Wakefield shopping center inventory for all nine markets. Local reports may show different figures because they include additional retail formats or use different geographic boundaries.
1. Raleigh-Durham
Raleigh-Durham leads the ranking because its low vacancy is supported by population growth, positive absorption, rising rents, and a small forward development pipeline.
Cushman & Wakefield measured shopping center vacancy at 3.3% in the second quarter. The market recorded approximately 275,000 square feet of positive absorption during the four quarters ending in June, while asking rents increased from $26.49 to $27.55 per square foot. Only about 57,000 square feet remained under construction.
The broader Colliers Raleigh-Durham retail report found an even tighter 2.51% first-quarter vacancy rate. Buildings smaller than 10,000 square feet had only 1.48% vacancy, showing how difficult it had become for restaurants, services, and smaller retailers to find suitable locations. Approximately 94% of the space delivered during the first quarter was already leased.
The demand case is reinforced by population growth. Raleigh-Cary added 36,793 residents between July 2024 and July 2025, a 2.4% increase that placed it among the country’s fastest-growing metropolitan areas. The brokerage market and Census metro are not geographically identical, but the figures confirm continued household growth within a central part of the retail market.
Approximately 472,000 square feet was delivered during the first half of 2026. That recent supply helps explain why vacancy increased from 2.9% a year earlier to 3.3%. The small remaining pipeline is favorable, but the projects already delivered must establish stable tenant sales and occupancy.
Best fit: Grocery-anchored neighborhood centers, small-format strip retail, medical and service properties, and centers serving established suburban growth corridors.
Main risk: Investors should map the recent deliveries and determine which properties compete for the same households and tenants. Metro growth will not correct weak access, poor visibility, or excessive nearby supply.
2. Austin

Austin combines substantial absorption with continued household growth and tight shopping center vacancy. Its development pipeline prevents it from taking the top position.
The market recorded approximately 749,000 square feet of positive four-quarter absorption. Vacancy stood at 4.2%, and asking rents reached $31.24 per square foot. Approximately 774,000 square feet was under construction, equal to about 1.5% of the measured shopping center inventory.
The Partners Real Estate Austin retail report recorded a lower 3.6% vacancy rate in its broader first-quarter inventory. Net absorption remained positive but slowed sharply to 26,230 square feet, leasing activity declined, and the construction pipeline continued to expand. The different vacancy rates reflect the firms’ property coverage, but both reports describe a tight market receiving meaningful new supply.
Austin-Round Rock-San Marcos added 53,796 residents between July 2024 and July 2025, the sixth-largest numerical metro gain in the country. The population reached approximately 2.62 million.
Approximately 362,000 square feet of shopping center space was delivered during the first half of 2026, with another 774,000 square feet underway. Austin also ranked among the leading U.S. markets for broader retail construction.
Rent growth has been limited despite strong absorption. Average asking rent was less than 1% higher than a year earlier and declined slightly from the first quarter. That suggests tenants retain negotiating leverage in some submarkets and that household growth will not automatically produce aggressive rent increases.
Best fit: Grocery-anchored and service-oriented centers in corridors where housing growth has already translated into occupied homes, traffic, and proven sales.
Main risk: Investors need to identify every proposed and active project within the property’s trade area. Several new centers can target the same households even when metro vacancy remains low.
3. Charlotte
Charlotte combines low vacancy, strong rent growth, and one of the country’s largest recent population gains.
Shopping center vacancy was 3.9% in the second quarter. Asking rents increased from $25.90 to $27.58 per square foot, a gain of approximately 6.5%. The market recorded about 96,000 square feet of positive four-quarter absorption.
A broader Colliers Charlotte retail report measured first-quarter vacancy at only 2.88%, marking three consecutive years below 3%. Vacancy in buildings smaller than 10,000 square feet was 1.97%, and well-located space returning to the market was generally claimed quickly.
Charlotte-Concord-Gastonia added 54,122 residents between July 2024 and July 2025, the fifth-largest numerical metro gain nationally. Its estimated population reached approximately 2.94 million.
The construction pipeline is manageable but not insignificant. Cushman & Wakefield tracked approximately 367,000 square feet under construction and about 147,000 square feet delivered during the first half of 2026.
Recent absorption has been uneven. Strong gains in late 2025 were followed by a first-quarter occupancy loss before the market returned to positive absorption in the second quarter. That pattern is one reason Charlotte ranks below Austin despite stronger rent growth.
Best fit: Grocery, restaurant, medical, fitness, and service-oriented centers near established residential and employment growth.
Main risk: Population growth can encourage several developers to target the same suburban corridors. Review retail construction alongside completed and occupied housing rather than relying on announced subdivisions.
4. Miami
Miami has the lowest shopping center vacancy in the ranking and some of the highest asking rents. Its recent absorption record and ownership costs prevent it from placing higher.
Cushman & Wakefield reported 3.0% vacancy and an average asking rent of $43.92 per square foot, up approximately 3.2% from a year earlier. The four-quarter absorption total was negative by approximately 121,000 square feet, while only about 142,000 square feet was under construction in the firm’s shopping center inventory.
The Colliers Q1 2026 Miami-Dade retail report also showed mixed conditions. Vacancy increased to 3.3% after approximately 382,000 square feet of negative quarterly absorption. That early-year weakness helps explain why Miami’s four-quarter total remained negative despite its limited available space.
Demographic data require caution as well. Miami-Dade County lost population between July 2024 and July 2025. One year does not determine long-term demand, and the market retains a large resident base, affluent households, tourism, international business, and extensive food and service spending. It does mean that an acquisition should not depend on the migration rates recorded earlier in the decade.
Miami’s high rents can support strong property income, but they also raise the amount a replacement tenant must earn to remain healthy. Insurance, property taxes, storm exposure, maintenance, and tenant buildout costs further increase the ownership burden.
Best fit: Grocery-anchored and necessity retail in established neighborhoods, along with proven high-income and visitor-oriented districts where tenant sales support current occupancy costs.
Main risk: Scarcity is already reflected in rents and pricing. Insurance, storm exposure, taxes, repairs, and tenant buildouts can reduce returns even when occupancy remains high.
5. Orange County
Orange County offers a mature retail market with low vacancy, limited shopping center construction, and a large existing consumer base.
Cushman & Wakefield measured 4.0% vacancy and approximately 390,000 square feet of positive four-quarter absorption. Asking rents averaged $39.59 per square foot, while only about 49,000 square feet remained under construction in its shopping center inventory.
The broader Kidder Mathews Q2 2026 Orange County retail report placed vacancy at 3.8%. It reported 240,744 square feet of positive second-quarter absorption, 284,179 square feet under construction, an average sales price of $572 per square foot, and an average cap rate of 4.9%.
Those investment figures demonstrate both the market’s strength and its principal weakness. Buyers continue to pay substantial prices for infill retail, which reduces the room available for leasing errors, capital costs, or weaker financing terms.
Orange County is not benefiting from rapid population growth. Its investment case instead rests on a population of more than 3 million, high barriers to development, limited availability, and a large established economy.
Best fit: Established grocery-anchored centers, infill strip retail, and properties with below-market leases that can be renewed without excessive improvement costs.
Main risk: High entry prices leave little tolerance for a major repair, tenant failure, or unexpected leasing expense. Scarcity should inform the price rather than excuse an unrealistic one.
Learn How Better Landlords Manage Better Rentals
Join our 2X weekly newsletter for clear, actionable guidance on property management, leasing, tenant issues, rental property operations, and real estate investing strategies you can actually use.
6. Phoenix
Phoenix produced the largest four-quarter absorption total among the nine markets. It also has the largest active shopping center pipeline.
The market absorbed approximately 947,000 square feet over the four quarters ending in June. Vacancy was 5.4%, and asking rents increased about 5.1% to $26.74 per square foot. Approximately 1.42 million square feet was under construction, while more than 818,000 square feet had already been delivered during the first half.
The broader Matthews Q2 2026 Phoenix retail report placed vacancy at 4.7% and asking rents at $27.20 per square foot. It reported approximately 941,000 square feet of absorption, 1 million square feet delivered during the preceding year, and another 2.7 million square feet under construction. Grocery-anchored centers and neighborhood retail in suburban growth corridors generated some of the strongest demand.
Phoenix-Mesa-Chandler added 59,065 residents between July 2024 and July 2025, the fourth-largest numerical metro increase in the country. The metro population rose to approximately 5.23 million.
The development response is rational in many locations. Outer communities need grocery stores, restaurants, medical providers, and services as new households arrive. The risk arises when several projects depend on the same proposed subdivisions or assume that recent migration will continue unchanged.
Best fit: Grocery-anchored and necessity retail in established growth corridors where housing is occupied, roads are complete, and household counts already support tenant sales.
Main risk: Investors must distinguish completed growth from planned growth. The pipeline also limits how aggressively rent increases should be projected.
7. Las Vegas
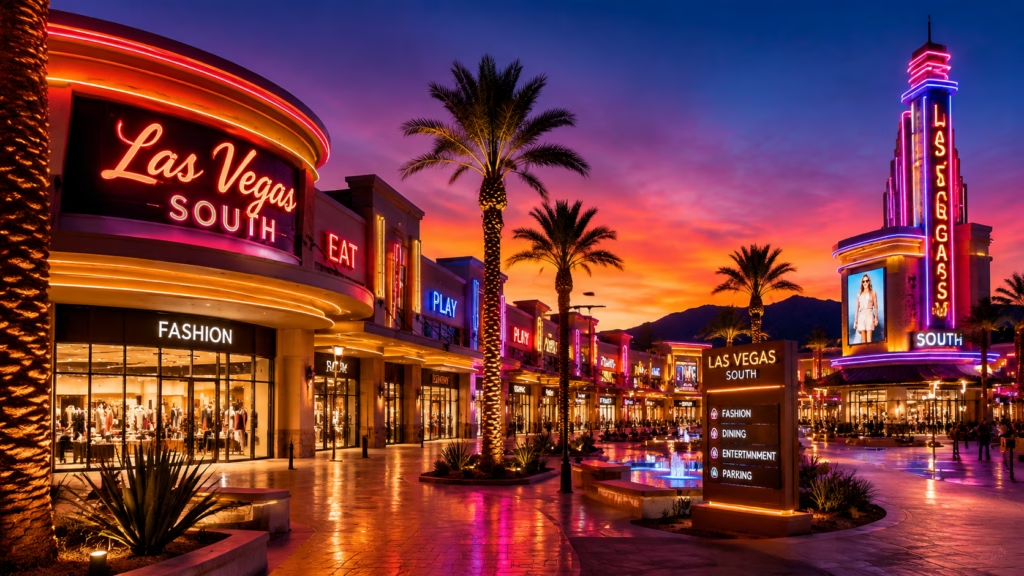
Las Vegas has developed a broader neighborhood retail base than its tourism reputation suggests, although visitor spending remains an important part of the local economy.
Cushman & Wakefield reported 5.2% shopping center vacancy, approximately 764,000 square feet of positive four-quarter absorption, and an average asking rent of $29.91 per square foot. About 764,000 square feet was under construction, with approximately 276,000 square feet delivered during the first half.
The verified Colliers Q1 2026 Las Vegas retail report measured 4.3% vacancy and 234,724 square feet of first-quarter net absorption. The weighted average asking rent increased to $1.96 per square foot per month on a triple-net basis, while shopping center investment sales volume increased from the preceding quarter.
Colliers noted that Southern Nevada’s vacancy rate had remained between 4.3% and 4.6% for three years despite relatively weak job growth, declining taxable retail sales, and continued e-commerce competition. The first quarter suggested a move from recovery toward growth, although not at the pace recorded in 2021 and 2022.
Neighborhood retail serving permanent residents should be separated from properties dependent on tourism, conventions, entertainment, or luxury spending. A grocery-anchored center in an established residential trade area may produce steady demand, while a tourism-oriented property can be more exposed to airline capacity, convention attendance, and consumer confidence.
Best fit: Neighborhood and community centers serving established residents, along with selective visitor-oriented properties whose rents remain supportable under conservative tourism assumptions.
Main risk: Tourism and discretionary spending can change quickly. New supply must also be evaluated separately in each residential trade area.
8. Nashville
Nashville remains one of the tightest shopping center markets in the country, but its recent occupancy results have been inconsistent.
Cushman & Wakefield reported 3.6% vacancy and approximately 83,000 square feet of positive four-quarter absorption. Asking rents increased from $28.20 to $29.15 per square foot. No shopping center space was delivered during the first half of 2026, and only about 131,000 square feet was under construction within its defined inventory.
The broader Matthews Q1 2026 Nashville retail report also placed vacancy at 3.6% but included a wider property universe. It reported approximately $331 million in quarterly investment sales, an average price of $292 per square foot, a 6.3% average cap rate, and asking rents of $30.26 per square foot.
The difference in construction totals is substantial. Matthews reported approximately 770,000 square feet underway, compared with 131,000 square feet in the Cushman shopping center dataset. This illustrates why investors should determine which freestanding, mixed-use, and specialty projects are included in each source before comparing pipeline figures.
Nashville nevertheless recorded negative absorption in the second quarter after stronger gains in late 2025 and early 2026. High rents may also reduce the replacement-tenant pool, particularly for restaurants and independent businesses facing rising labor and buildout costs.
Best fit: Neighborhood and necessity retail, along with mixed-use properties whose tenant rosters are not overly concentrated in restaurants or discretionary concepts.
Main risk: Stress-test upcoming rollover for local businesses. A low metro vacancy rate does not guarantee that a high-rent space can be released without substantial concessions.
9. Charleston
Charleston completes the ranking because it combines low vacancy, positive absorption, modest rent growth, and an unusually small construction pipeline.
Cushman & Wakefield reported 3.8% shopping center vacancy and approximately 155,000 square feet of positive four-quarter absorption. Asking rents increased from $23.87 to $24.27 per square foot. Only about 26,000 square feet was under construction against an inventory of nearly 20 million square feet.
A Colliers Charleston retail report from late 2025 found vacancy below 3% as new leasing focused on smaller shop space. Newly available units were being released quickly in high-demand submarkets such as Summerville, while several former anchor spaces were being converted to nontraditional retail uses.
Charleston’s smaller size is both an advantage and a limitation. Controlled supply supports occupancy, but one major tenant opening or closure can have an outsized effect on quarterly statistics. Transaction volume and comparable sales are also less extensive than in Miami, Phoenix, or Orange County.
The market’s tourism base adds another source of spending, but individual properties vary widely in their dependence on visitors. Neighborhood retail serving permanent households carries a different risk profile from restaurants or discretionary stores in tourism-heavy districts.
Best fit: Grocery-anchored centers, neighborhood retail, and properties with stable service tenants and manageable lease rollover.
Main risk: Smaller markets can be less liquid and more sensitive to individual tenant failures. Properties dependent on one employer, tourism district, or narrow customer group require additional scrutiny.
Three Retail Markets Worth Watching
Salt Lake City
Salt Lake City reported 3.7% vacancy and approximately 210,000 square feet of positive four-quarter absorption. Only about 18,000 square feet was under construction in the principal shopping center dataset.
It missed the ranking because asking rents declined from $26.93 to $26.64 per square foot over the year, and second-quarter absorption was negative. The market remains tight, but leasing and rent momentum need to improve before it moves higher.
Palm Beach
Palm Beach produced approximately 347,000 square feet of positive four-quarter absorption, while asking rents increased more than 8% to $37.60 per square foot. Vacancy was 5.0%, and about 230,000 square feet was under construction.
Strong rent growth and demand warrant attention, but acquisition pricing, insurance, storm exposure, taxes, and other ownership costs can narrow the margin for error.
Cincinnati
Cincinnati generated approximately 355,000 square feet of positive four-quarter absorption. More than 535,000 square feet was absorbed in the second quarter alone, lowering vacancy from 6.6% to 5.6%. Asking rents increased approximately 3.5% over the year. Cushman & Wakefield identified Cincinnati as one of the quarter’s notable absorption markets.
Cincinnati remained outside the ranking because most of the recent improvement occurred in one quarter. More evidence is needed before treating the rebound as a sustained trend.
What Could Change the Rankings
Consumer spending could lose momentum
Consumer spending remained resilient during the second quarter, but Cushman & Wakefield reported that spending was becoming increasingly concentrated among higher-income households. The top 20% of earners accounted for nearly 60% of personal outlays. Lower- and middle-income consumers faced greater pressure from living costs, favoring grocery, discount, and value retailers over discretionary concepts.
A market with low vacancy can still contain tenants whose sales do not support current rents. Investors should examine actual tenant sales, occupancy-cost ratios, and trade-area income rather than assuming national spending growth will protect every lease.
Closures will affect properties differently
Store closures can create opportunities for landlords when the space is in a strong center and can be released without major reconstruction. A former pharmacy, department store, or specialty box may be more difficult and expensive to divide than a smaller restaurant or service unit.
The relevant question is not merely whether space becomes vacant. It is whether a dependable replacement tenant can use the building, afford the rent, and open without requiring an excessive allowance.
E-commerce will keep gaining share
Online sales continue to grow more quickly than overall retail sales. That does not eliminate physical retail, but it increases the importance of tenant category, omnichannel use, and the role a store plays in customer acquisition, fulfillment, service, or experience.
Properties dependent on tenants selling easily shipped discretionary products face more direct online competition than centers anchored by groceries, restaurants, medical services, fitness, beauty, automotive, or other uses that require a physical location.
Construction is concentrated in growth markets
National construction remains low, but the supply is not distributed evenly. Cushman & Wakefield reported that several Southern markets experienced temporary increases in lease-up vacancy after years of population growth drew new projects forward.
A property can operate in a favorable national environment while facing excessive supply within its own trade area. Investors should map every active project rather than relying on the national pipeline percentage.
Population growth is slowing
The Census Bureau found that average metropolitan population growth declined from 1.1% between 2023 and 2024 to 0.6% between 2024 and 2025. A majority of metropolitan areas grew more slowly than during the previous year.
Retail projections based on the migration rates of earlier years may be too optimistic. Completed housing, occupied households, traffic, and tenant sales provide stronger evidence than announcements about future development.
Acquisition pricing could remove the advantage
Low vacancy and limited construction attract capital. The strongest markets may therefore offer the least room for error when properties trade at prices that assume aggressive rent increases or uninterrupted occupancy.
A lower-ranked market can produce a better return when the property has a stronger rent roll, lower purchase basis, fewer capital needs, and more conservative financing. The ranking identifies markets worth screening; it does not rank individual acquisitions.
How Investors Should Use the Ranking
Begin by defining the property format. A grocery-anchored center, neighborhood strip center, urban storefront, regional mall, and single-tenant net-lease property should not be evaluated with the same assumptions.
Next, move from the metro level to the actual trade area. Review:
- Existing and planned competing centers
- Household count and income
- Completed and planned housing
- Daytime employment
- Traffic patterns, visibility, and access
- Parking and turning movements
- Tenant sales where available
- Planned roads and infrastructure
Pay particular attention to whether surrounding housing has been completed and occupied. Proposed homes do not buy groceries or visit restaurants. A center serving existing households carries less development risk than one whose projections depend on several years of future construction.
Review the rent roll rather than relying on market vacancy. Important provisions include expiration dates, renewal options, co-tenancy clauses, termination rights, exclusive-use restrictions, expense caps, percentage rent, assignment rights, guarantees, and tenant-improvement obligations.
Tenant quality must also be evaluated by use and occupancy cost. A fully leased center may still carry substantial risk when several tenants have thin margins, high rent-to-sales ratios, or leases expiring during the same year.
Compare current contract rents with realistic market rents. Below-market leases can create future income growth, but only when the tenant can afford the increase or the space can be released without excessive downtime and improvements. Above-market leases can make current income appear strong while creating a future rollover problem.
Review the physical property carefully. Roofs, parking lots, drainage, lighting, facades, signs, mechanical systems, and accessibility work can require substantial capital. Deferred maintenance can turn an attractive initial yield into a much lower return.
Finally, stress-test the acquisition. Model slower rent growth, a major tenant closure, longer releasing periods, higher tenant-improvement allowances, increased insurance and taxes, rising common-area costs, higher financing expenses, and a higher exit cap rate.
A strong market can help a well-bought property. It cannot correct an unrealistic purchase price, weak leases, or a poor location.
Where Retail Investors Still Have Room to Buy Well
Retail real estate continues to benefit from years of limited construction, but the strongest markets add another source of demand.
Raleigh-Durham, Austin, Charlotte, and Phoenix are gaining households and retail customers. Miami and Orange County offer scarcity and high occupancy, although investors must accept higher entry and ownership costs. Las Vegas and Nashville combine tight availability with active consumer markets, while Charleston provides controlled construction and low vacancy on a smaller scale.
The first-ranked market will not automatically produce a better return than the ninth. Purchase price, tenant quality, lease structure, physical condition, financing, and the immediate trade area will determine the result.
The best retail real estate markets for 2026 are those where tenants still compete for good locations, new construction remains supportable, and the acquisition price leaves enough room for leasing costs, capital work, and changes in consumer demand.